Abstract: Novel ZrB2-matrix composites were designed and prepared by in-situ introducing SiC and Zr2[Al(Si)]4C5 simultaneously for the first time. The obtained composites were dense and showed good mechanical properties, especially the strength and toughness, 706 MPa and 7.33 MPa·m1/2, respectively, coupled with high hardness of 21.3 GPa, and stiffness of 452 GPa. SiC and Zr2[Al(Si)]4C5 constituted a reinforcing system with synergistic effects including grain refinement, grain pull-out as well as crack branching, bridging, and deflection. Besides, the oxidation results of the composites showed that the oxidation kinetics followed the parabolic law at 1600 ℃, and the oxidation rate constants increased with the increase of Zr2[Al(Si)]4C5 content. The formation and evolution model of the oxidation structure was also investigated, and the oxide scale of the composite exhibited a three-layer structure.
Keywords: ZrB2-matrix composites; ultra-high temperature ceramics (UHTCs); mechanical properties; strengthening and toughening mechanism; oxidation behavior
1 Introduction
Because of the extremely high melting points, and excellent physical and chemical properties, borides and carbides of IVB and VB transition metals, such as ZrC, ZrB2, HfC, HfB2, and TaC, are attractive representatives of ultra-high temperature ceramics (UHTCs) [1–3]. This group of materials can be adapted to extreme environments and used in the ultra-fast long-duration flight, cross-atmosphere round-trip flight, and rocket propulsion systems [3–7]. Thus, they can be applied to the critical parts or components withstanding extremely high temperatures such as aircraft nose cones, leading edges of wings, and hot ends of engines [3–7]. As the critical materials of aerospace vehicle components, UHTCs have become the main object of competitive research in the material fields around the world.
The ZrB2–SiC binary system is the main research object of ZrB2-based UHTCs. The comprehensive performances of ZrB2–SiC composite ceramics are better than that of monolithic ZrB2 ceramics [7–11]. However, when only SiC is added to ZrB2 as single reinforcement, the strengthening and toughening effect is limited. It is still difficult to meet the requirements used in extreme environments; thus, the properties of ZrB2–SiC need further improvement. Based on the ideal multicomponent strengthening [12–15], one of the effective ways is to introduce another suitable reinforcement into ZrB2–SiC and form multiple reinforcements with SiC. As one of the UHTCs, ZrC is a good reinforcement, and it can increase the service temperature of ZrB2-matrix composites [16]. References [17–25] indicate that ZrB2–SiC–ZrC ternary composite ceramics exhibit improved room-temperature mechanical properties, ablation resistance, and thermal shock resistance compared with those of ZrB2–SiC binary composite ceramics. However, because of the low oxidation resistance of ZrC, the ternary composite seems to show unsatisfactory oxidation resistance and high-temperature strength [25,26]. Additionally, the toughness of ZrB2–SiC–ZrC composites is still unsatisfactory. Therefore, the key to obtaining ZrB2-based composites with good comprehensive performance is to select appropriate reinforcements with excellent comprehensive properties.
In recent years, researchers have prepared a new quaternary layered material Zr–Al(Si)–C, e.g., Zr2[Al3.56Si0.44]C5 (abbreviated as Zr2[Al(Si)]4C5), by simultaneously introducing Al and Si into ZrC [27]. Zr2[Al(Si)]4C5 exhibits good oxidation and corrosion resistance, and strong damage tolerance. Also, it shows better oxidation resistance, toughness, and strength than those of ZrC [27–30]. These unique characteristics make Zr2[Al(Si)]4C5 be a novel ultra-high temperature material. Zr2[Al(Si)]4C5 grains exhibit columnar shape with a high aspect ratio [28], which can induce an effect similar to that of whiskers on the ceramic matrix [31]. Besides, Zr2[Al(Si)]4C5 shows good high-temperature properties and low theoretical density [27,32]. In summary, Zr2[Al(Si)]4C5 is appropriate to be selected as an ideal reinforcing material for the ZrB2 matrix. With the introduction of Zr2[Al(Si)]4C5 into ZrB2–SiC, SiC and Zr2[Al(Si)]4C5 can constitute an effective binary reinforcing system with different scales and morphologies, which is expected to show significant strengthening effects on the ZrB2-matrix and further improve the properties.
Therefore, in this work, we introduced Zr2[Al(Si)]4C5 into a ZrB2–SiC by an in-situ hot-pressing route in one step for the first time. The composition, mechanical properties, and microstructure were investigated as well as the oxidation behavior. In addition, the mechanisms of strengthening and toughening, and oxidation of the composites were also studied.
2 Experimental
2. 1 Material preparation
Commercial powders of ZrH2 (99.95%, ≤ 38 μm, GRIPM Advanced Materials Co., Ltd., China), B4C (99.95%, 3–10 μm, ZhongNuo Advanced Material Technology Co., Ltd., China), Si (99.95%, ≤ 38 μm, GRIPM Advanced Materials Co., Ltd., China), Al (99.95%, ≤ 38 μm, GRIPM Advanced Materials Co., Ltd., China), and graphite (99.95%, ≤ 10 μm, ZhongNuo Advanced Material Technology Co., Ltd., China) were used as raw materials. The raw powders were weighed accurately according to the designed reaction and then were mixed in a Teflon jar filled with argon (Ar) and roller milled for 24 h. The obtained powder mixture was put in a graphite mold (internal dimensions of 64 mm × 64 mm) and then put into the hot-pressing furnace (Chenhua ZT-40-21Y, Shanghai, China). Subsequently, the composite ceramics were in-situ sintered at 1850 ℃ with the pressure of 25 MPa for 1 h in flowing Ar. The preparation process is the same as our reported work [33], and it is also shown in Fig. 1.
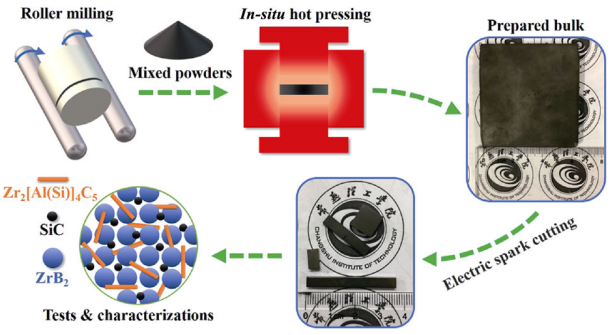
Fig. 1 Schematic illustration of the experimental process.
2. 2 Characterization
The apparent porosity and volume density of the specimens were determined by Archimedes method. X-ray diffraction (XRD, Rigaku Max-2200, Tokyo, Japan) was used for phase analysis. The chemical states of elements were characterized by the X-ray photoelectron spectroscope (XPS, Nexsa, Thermo Fisher, Waltham, USA). The XPS data were analyzed by the surface chemical analysis software (Thermo Avantage) and NIST XPS database. The surface and fracture morphologies were analyzed by the scanning electron microscope (SEM, JEOL JSM-5900, Tokyo, Japan). And, the energy spectrometer equipped in SEM, i.e., energy dispersive spectroscopy (EDS), was used to conduct the elemental analysis and phase composition.
2. 3 Mechanical property test
The specimens with the required dimensions were cut by the electric spark and then were polished. The processed samples were used for the tests of strength, toughness, Vickers hardness, and Young’s modulus. Ten specimens with dimensions of 3 mm×4 mm×36 mm and ten specimens with dimensions of 2 mm×4 mm×22 mm were used for strength and toughness tests, respectively. The strength and toughness were tested in the universal testing machine (SUNS UTM2203, Shenzhen, China), and the test method and process were the same with that in our reported work [13]. The bending strength was measured using a three-point bending method with a span of 30 mm and a cross head speed of 0.5 mm/min. The fracture toughness was determined using the single-edge notched beams (SENB) method with a span of 16 mm and a cross head speed of 0.05 mm/min. The notch with a depth of 2 mm and width ≤ 0.26 mm was made by a dicing saw. Vickers hardness of the polished samples with sizes of 8 mm×8 mm was tested by a hardness tester (Huayin 200HV-5, Laizhou, China) under the load of 1 kg for 10 s, and twenty data for each sample were collected to obtain the results. The modulus (sample size of 10 mm×10 mm) was evaluated by ultrasonic material test system (RITEClab UMS-100, Chelles, France).
2. 4 Oxidation resistance test
The high-temperature oxidation test was carried out in a tube furnace (Kejing GSL-1700X, Hefei, China). When the temperature in the furnace reached and was stable at the target temperature (1600 ℃), the polished samples with a size of 3 mm×4 mm×8 mm were placed in the middle of the furnace immediately. After being held for some time (0.5, 1, 2, 3, and 5 h), the oxidized samples were taken out directly. The oxidation weight gain was measured using an electronic balance (Mettler Toledo ME204E, Shanghai, China) with an accuracy of ±0.1 mg. The phase compositions and chemical states of the oxidized scales were characterized using XRD and XPS. The microstructure of the oxide scale was analyzed using SEM, and the chemical analysis was carried out by the EDS.
3 Results and discussion
3. 1 Feasibility analysis
ZrB2–SiC–Zr2[Al(Si)]4C5 composite ceramics were prepared from the mixed powders of ZrH2, Al, Si, C, and B4C. First, ZrH2 decomposed into Zr at about 730 ℃. Subsequently, the three phases, i.e., ZrB2, SiC, and Zr2[Al(Si)]4C5, began to form. In-situ preparation of binary ZrB2–SiC was reported, and Refs. [34,35] showed that ZrB2–SiC with the ratio of 2:1 could be formed by in-situ reaction sintering at 1800–1900 ℃ in Ar through the following reaction:
2Zr + B4C + Si = 2ZrB2 + SiC (1)
References [28,36] showed that Zr2[Al(Si)]4C5 compound could be obtained by the following in-situ reaction sintering at 1850–1900 ℃ in Ar:
2Zr + 4Al(Si) + 5C = Zr2[Al(Si)]4C5 (2)
Thus, in-situ ZrB2–SiC–Zr2[Al(Si)]4C5 can be prepared and be stable at 1850 ℃ in Ar. Additionally, the content of Zr2[Al(Si)]4C5 can be adjusted by controlling the proportion of raw materials. Thus, the material preparation proposed in this work is feasible. And, the preparation route is shown in the following reaction:
(2 + x)Zr + B4C + Si + 4xAl(Si) + 5xC = 2ZrB2 + SiC + xZr2[Al(Si)]4C5 (3)
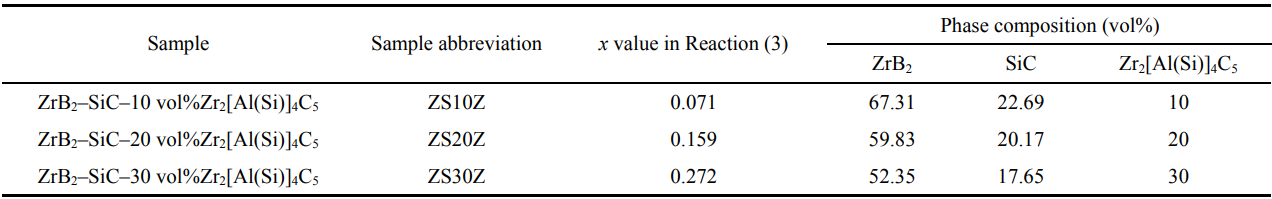
According to Reaction (3), ZrB2–SiC–xZr2[Al(Si)]4C5 ceramics containing 10, 20, and 30 vol% Zr2[Al(Si)]4C5 were obtained in this work. The theoretical phase compositions of the composites are listed in Table 1.
Table 1 Phase compositions of ZrB2–SiC–Zr2[Al(Si)]4C5 composites
3. 2 Phase composition
Figure 2 shows the XRD results of the as-sintered composites. From the patterns, only the peaks of ZrB2, SiC, and Zr2[Al(Si)]4C5 were detected, of which the XRD patterns were all consistent with Refs. [28,34–36]. With the Zr2[Al(Si)]4C5 content increasing, its relative intensity of the peaks increased, while those of ZrB2 and SiC decreased. From the backscattered electron images shown in Fig. 3, the three expected phases with different contrasts were observed. Combined with the EDS analysis, the light gray phase was ZrB2, the black phase was SiC, and the dark gray phase was Zr2[Al(Si)]4C5. The results of phase analysis show that in-situ sintered ZrB2–SiC–Zr2[Al(Si)]4C5 composite ceramics with desired phase content can be successfully obtained by hot pressing via the designed route at 1850 ℃.
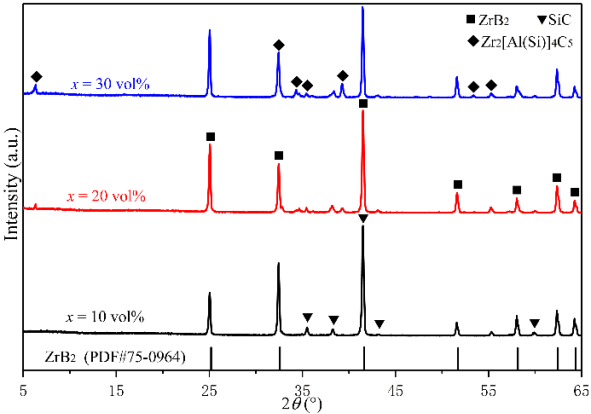
Fig. 2 XRD patterns of ZrB2–SiC–xZr2[Al(Si)]4C5 composite ceramics prepared at 1850 ℃.
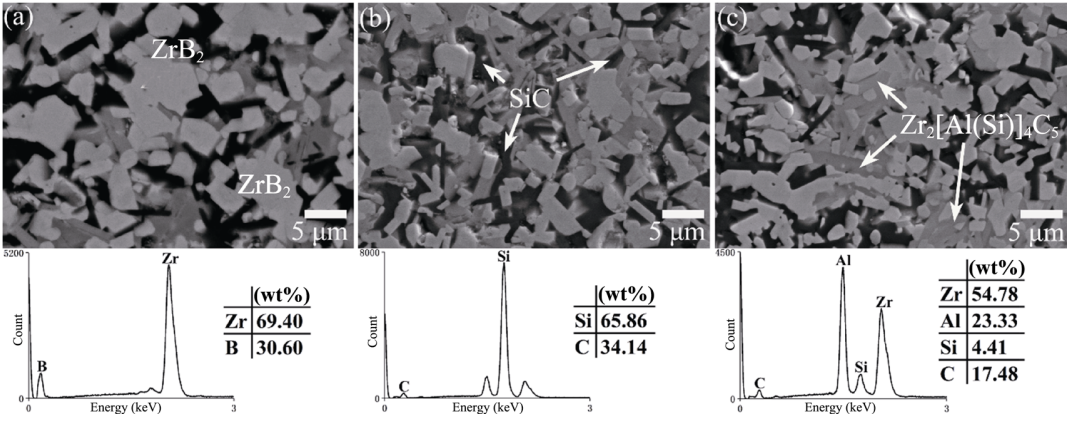
Fig. 3 Backscattered electron images of the polished surfaces and the corresponding EDS spectra of (a) ZS10Z, (b) ZS20Z, and (c) ZS30Z.
The sintering properties of the composites are listed in Table 2. The measured data showed that all three composites were dense, and the composites exhibited a high relative density of ˃ 99% and a low apparent porosity of < 0.05%. In addition, due to the lower density of Zr2[Al(Si)]4C5 (4.50 g/cm³) [28] than that of ZrB2–SiC (molar ratio of 2:1, 5.37 g/cm³ [34]), the density of the composite decreased with the Zr2[Al(Si)]4C5 content increasing. As is known, the use of lightweight materials is one of the primary considerations in the design and manufacture of aerospace vehicles, which is beneficial for weight reduction and speed increase. Thus, novel ZrB2–SiC–Zr2[Al(Si)]4C5 ceramic with low density is an attractive candidate for the application to the high-temperature environment.
Table 2 Comparison of some properties of in-situ hot-pressed ZrB2–SiC–Zr2[Al(Si)]4C5 and ZrB2–SiC

3. 3 Mechanical properties and microstructure
The measured mechanical properties of ZrB2–SiC–Zr2[Al(Si)]4C5 are listed in Table 2, and the corresponding values of ZrB2–SiC are also given for comparison. With the Zr2[Al(Si)]4C5 content increasing from 10 to 30 vol%, the strength and toughness of the specimens increased from ~590 MPa and ~5.61 MPa·m1/2 to ~706 MPa and 7.33 MPa·m1/2, and then decreased to ~572 MPa and 6.78 MPa·m1/2, respectively. According to the dependences of Zr2[Al(Si)]4C5 content on strength and toughness, the composite containing around 20 vol% Zr2[Al(Si)]4C5 exhibited the highest strength and toughness over ~706 MPa and ~7.33 MPa·m1/2, respectively. And, ZS20Z showed comparable mechanical properties, especially higher toughness, compared with ZrB2–SiC–ZrC [17]. Despite that the composites containing 10 and 30 vol% Zr2[Al(Si)]4C5, i.e., ZS10Z and ZS30Z, showed decreased strength and toughness, they still showed obviously higher values than those of ZrB2–SiC prepared at 1800–1900 ℃ reported by Zhang et al. [34,35]. It can be concluded that the composites exhibit better strength and toughness than those of ZrB2–SiC prepared under the same condition. So, the incorporation of Zr2[Al(Si)]4C5 is beneficial for the further improvement of strength and toughness.
As can be observed in Fig. 3, the grain sizes of ZrB2 decreased with the Zr2[Al(Si)]4C5 content increasing, which showed the grain refining effect. From the fracture surfaces shown in Fig. 4, the grain refining effect could also be observed. And, there were no pores in the grains or at the grain boundaries, and the composites were dense, which was in good agreement with the density measurement. Besides, the fracture mode exhibited a mixture of intergranular and transgranular mode, and the rough fracture surfaces showed visible grain pull-out. The above fracture characteristics were beneficial for the improvement of strength and toughness. However, the high content of Zr2[Al(Si)]4C5 in ZS30Z led to the decrease of strength and toughness. Due to the thermo-elastic mismatch between ZrB2 and Zr2[Al(Si)]4C5, residual stress arose at the phase interfaces [12]. The coefficients of thermal expansion of ZrB2 and Zr2[Al(Si)]4C5 are 6.8×10⁻⁶ and 8.1×10⁻⁶, respectively [13,28]. So, according to Hsueh’s formula, the radial matrix stress was tensile [12,13]. The high content of Zr2[Al(Si)]4C5 in ZS30Z could make the tensile stress increase, resulting in the decreased strength and toughness. Besides, the grain refinement was not evident enough in ZS30Z, and the aggregation of some particles could be observed. These could be the reasons for the decrease of strength and toughness [12–14].
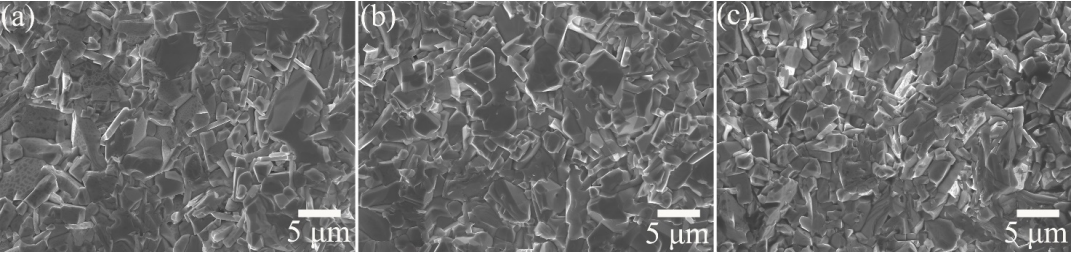
Fig. 4 SEM images of the fracture surfaces of (a) ZS10Z, (b) ZS20Z, and (c) ZS30Z.
The crack propagations of the composites on the polished surfaces are shown in Fig. 5. The crack deflection around the particles could be observed. Besides, the crack branching and bridging could also be observed on the crack path. These obvious characteristics in the composites could improve the strength, especially the toughness. For the specimen with low Zr2[Al(Si)]4C5 content, i.e., ZS10Z, the crack was relatively straight, which should be similar to that in ZrB2–SiC. In ZS20Z, the crack was obviously circuitous, while that in ZS30Z seemed to be relatively straight again. This shows that the strength and toughness are related to the crack deflection degree, which can extend the crack propagation path, consume the fracture energy, and therefore improve the strength and toughness [12,13]. The crack is easy to propagate along the load direction during the fracture, so the angle between the directions of the crack and the load may have a direct relationship with the strength and toughness. To further investigate this, the deflection angles between the directions of the fracture crack and the load of all the broken bars were counted. The optical microscope photographs of the fracture crack are shown as representatives in Fig. 6. According to the results of statistical calculation, ZS20Z showed the maximum deflection angle between the directions of the crack (arrows) and the load (dotted lines). The deflection angle of the crack in ZS20Z was ~10°±4°, while those in ZS10Z and ZS30Z were ~3°±3° and ~6°±3°, respectively. This was consistent with the change of strength and toughness. In addition, from the Vickers indentation on the polished surface of ZS20Z (Fig. 5(d)), the crack deflection, bridging, and branching on the crack propagation path and the grain pull-out near the indentation edge could be observed. In summary, these data provided good support for the improved strength and toughness of the prepared materials, especially for ZS20Z.

Fig. 5 SEM images of crack propagation on the polished surfaces of (a) ZS10Z, (b) ZS20Z, and (c) ZS30Z; and (d) a typical micrograph of Vickers indentation on the polished surface of ZS20Z.
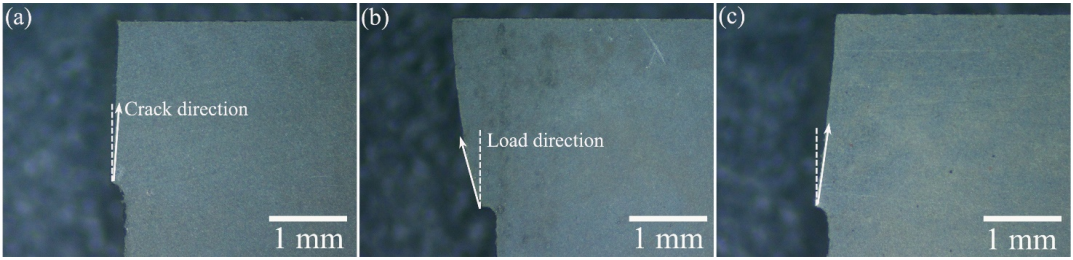
Fig. 6 Optical photographs of the deflection angles between the fracture crack and the load of the representative broken specimens: (a) ZS10Z, (b) ZS20Z, and (c) ZS30Z. The dotted line refers to the vertical load direction, and the arow line refers to the crack path direction.
Additionally, due to the lower Vickers hardness and Young’s modulus of Zr2[Al(Si)]4C5 than those of ZrB2–SiC, the hardness and modulus of the composites should theoretically decrease with the increase of the Zr2[Al(Si)]4C5 content according to the mixing rule, which were consistent with the results. The measured hardness and modulus of the composites decreased slowly from ~21.3 and 452 GPa for ZS10Z to ~16.8 and 419 GPa for ZS30Z, respectively.
3. 4 Oxidation behavior
3.4.1 Oxidation kinetics
The oxidation kinetics was investigated through the relationship curves of the weight gain/surface area
(Δw/s) and the oxidation time (t). The corresponding curves of the composites are plotted in Fig. 7(a). All the composites exhibited similar curves, and it indicated that the composites had the same oxidation kinetics in this test condition. From the curves, it could be observed that the Δw/s increased significantly first and then relatively slowed down with t increasing. This was possibly corresponding to two oxidation stages. At the initial oxidation, the oxidation products formed rapidly with a certain thickness, which constituted a protective layer on the surface to prevent further oxidation. After that, the oxidation entered the passivation stage. From the curves, it also clearly showed that the Δw/s increased with the Zr2[Al(Si)]4C5 content increasing at the same t. For example, the Δw/s increased from 0.268 kg·m–2 for ZS10Z to 0.534 kg·m–2 for ZS30Z after oxidation at 1600 ℃ for 5 h. The results meant that the oxidation resistance decreased with the Zr2[Al(Si)]4C5 content increasing. The relationship curves of (Δw/s)² versus t and the corresponding linear fitting curves (dotted line) adjusted are plotted in Fig. 7(b). R² ≥ 0.97 is also given. The results indicated that the oxidation kinetics of the composites followed a parabolic law [33] at 1600 ℃. And, the calculated slopes of the linear curves are the oxidation rate constant (k1) of the composites, which are shown in Table 3. The increase of Zr2[Al(Si)]4C5 content led to the increase of k1, which increased from 0.432×10⁻⁵ kg²·m–4·s–1 for ZS10Z to 1.653×10⁻⁵ kg²·m–4·s–1 for ZS30Z. Ignoring the volatilization of oxidation products, the results confirm the decreased oxidation resistance of the composites with the Zr2[Al(Si)]4C5 content increasing.

Fig. 7 Relationship curves of (a) oxidation weight gain/surface area (Δw/s) versus the oxidation time (t); (b) (Δw/s)² versus t.
Table 3 Oxidation rate constant of ZrB2–SiC– Zr2[Al(Si)]4C5 at 1600 ℃
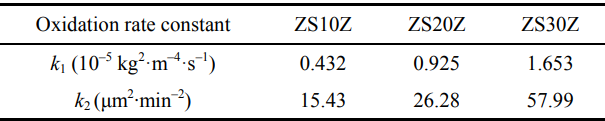
Besides k1, the oxidation kinetics can also be investigated from the relationship curves between the thickness of the oxidation layer (δ) and t [37], which are plotted in Fig. 8(a). It showed similarity to the shape and trend of Δw/s versus t. The δ² displayed in Fig. 8(b) also showed a linear relationship versus t. Based on the results, δ was indispensable in the investigation of the oxidation kinetics for the composites, and the oxidation kinetic curves also followed the parabolic law here. It is notable that the oxidation kinetics may be reflected better by the relationship between δ and t because of the evaporation and volatilization of gaseous oxidation products. According to the data in Fig. 8(b), the calculated rate constant, i.e., k2 (listed in Table 3), of ZS10Z was ~15.43 μm²·min–2, which was ~59% and ~27% of that of ZS20Z (~26.28 μm²·min–2) and ZS30Z (~57.99 μm²·min–2), respectively. Accordingly, the measured δ of ZS30Z was ~980 μm after oxidation for 5 h, which was also obviously thicker than that of ZS10Z (~516 μm). Above all, the composites started to decrease their oxidation resistance with the Zr2[Al(Si)]4C5 content increasing. Nevertheless, compared with ZrB2–SiC–ZrC, the composites still seemed to show improved oxidation resistance [25].

Fig. 8 Relationship curves of (a) thickness of the oxide scales (δ) and (b) δ² versus t.
3.4.2 Oxidation surfaces and products
Figure 9 is the XRD patterns of the oxide surfaces of the composites after oxidation for different time. The oxidation products in the oxide scales were composed of mainly ZrO2 and aluminosilicate as well as trace Al2O3 and ZrSiO4. ZrO2 was produced by the oxidation of ZrB2 and Zr2[Al(Si)]4C5, and Al2O3 was produced only by the oxidation of Zr2[Al(Si)]4C5. SiO2 was produced by the oxidation of Si element in the composite, and it could be consumed by the reactions with ZrO2 and Al2O3 to form ZrSiO4 and aluminosilicate, respectively. It is noticeable that aluminosilicate has a complicated phase composition with the chemical formula of xAl2O3·ySiO2. Additionally, the product formed by the oxidation of B element, i.e., B2O3, has a high vapor pressure and cannot exist stably under this oxidation condition [38,39]. Therefore, according to the phase composition of the oxide surface and previous works [33,38,40–42], some main reactions involved in the oxidation of the composites were described as follows:
2ZrB2–SiC–xZr2[Al3.56Si0.44]C5+(6.5+7.61x)O2→(2+2x)ZrO2+(1+0.44x)SiO2+1.78xAl2O3+2B2O3↑+(1+5x)CO↑ (4)
xSiO2 + yAl2O3 → xAl2O3·ySiO2 (aluminosilicate) (5)
ZrO2 + SiO2 → ZrSiO4 (6)
After oxidation under the same condition, with the Zr2[Al(Si)]4C5 content increasing, the composition of aluminosilicate changed, and the formation content of aluminosilicate increased. For the same sample, with further oxidation, the formed Al2O3 could be consumed to produce aluminosilicate. However, the aluminosilicate content in the oxide surface seemed to decrease. This could be due to the formation of SiO2 glass phase covering the surface [41].

Fig. 9 XRD patterns of the ceramic surfaces after oxidation at 1600 ℃ for 0.5, 1, and 3 h: (a) ZS10Z, (b) ZS20Z, and (c) ZS30Z.
To further investigate the chemical state and confirm the composition of the oxide scale, the XPS spectra of representative ZS20Z after oxidation at 1600 ℃ for 2 h is shown in Fig. 10. The XPS results confirmed the presence of Zr, Si, Al, and O in the oxide products. The high-resolution spectra calibrated by the C 1s signal of 284.8 eV were presented as well as the corresponding fitting curves. As shown in Fig. 10(a), the two peaks at ~182.0 eV (Zr 3d5/2) and ~184.4 eV (Zr 3d3/2) corresponded to the Zr–O bond, and the weak peaks detected at ~183.4 and ~185.7 eV represented the presence of Zr–O–Si bond. This indicated that the oxidation products containing Zr were mainly composed of ZrO2 and a small amount of ZrSiO4. The formation of ZrSiO4 was also confirmed in the spectra of the Si 2p band shown in Fig. 10(b), in which the peak at ~102.8 eV belonging to the bond of Zr–O–Si was detected. Besides, the peaks at ~102.2 and ~103 eV were assigned to the bonds of Al–O–Si and Si–O from aluminosilicate and SiO2 glass phase, respectively. In the spectra of the Al 2p band, i.e., Fig. 10(c), two peaks at ~74.4 and ~74.6 eV corresponding to the bonds of Al–O–Si and Al–O could be detected and identified as aluminosilicate and trace Al2O3, respectively. Therefore, the XPS results were consistent with the composition analysis and the oxidation reactions mentioned above.
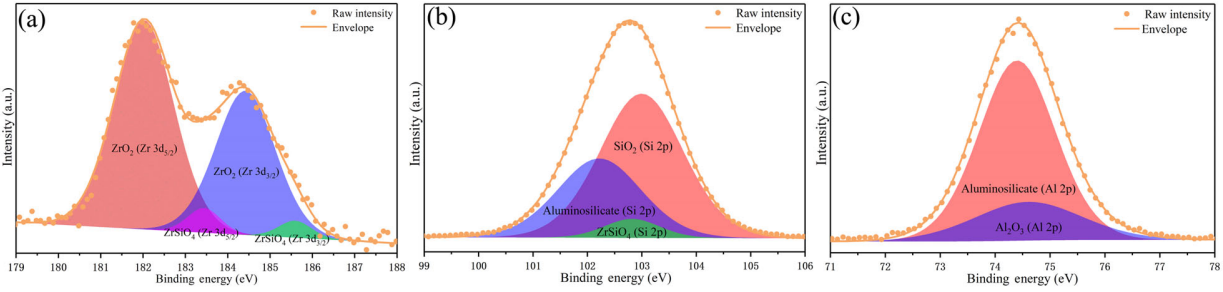
Fig. 10 XPS spectra of the oxide scale of ZS20Z after oxidation at 1600 ℃ for 2 h: (a) Zr 3d, (b) Si 2p, and (c) Al 2p.
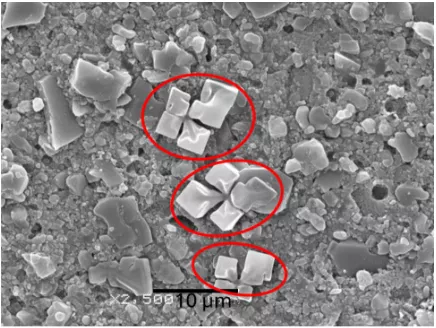
The surface morphologies of the composites after oxidation are presented in Fig. 11. From Figs. 11(a) and 11(b), the surface of oxidized ZS10Z at 1600 ℃ for 1 h consisted of a continuous oxide surface, which was relatively flat and dense. This could be ascribed to the abundant SiO2 glass phase produced during the oxidation. The formation and distribution of oxide products were further investigated by the EDS mapping results shown in Figs. 11(g)–11(i). It is notable that ZrO2 exhibited two different morphologies, i.e., the dendritic and granular grains. The dendritic morphology of ZrO2 was also found in Ref. [43]. For the oxide surface of ZS20Z shown in Figs. 11(c) and 11(d), it became rough, and the holes caused by the volatilization of gaseous products, e.g., B2O3 and CO, could be observed. The increasing content of Zr2[Al(Si)]4C5 led to a decrease content of SiC. So, the content of formed SiO2 also decreased, while the content of formed Al2O3 increased, and more aluminosilicate was produced by Reaction (5). Additionally, SiO2 on the surface could also volatilize gradually by the following reaction [38,40]:
SiO2 → SiO↑ + 0.5O2↑ (7)
Thus, the filling effect of the SiO2 glass phase among these products was diminished. Despite that, the produced SiO2 seemed to fill in most of the holes during the oxidation of ZS20Z, as shown in Fig. 11(d). However, with further increasing the content of Zr2[Al(Si)]4C5, the limited SiO2 seemed to not fill the holes, and the deep holes could be observed clearly in the oxide scale of ZS30Z as shown in Figs. 11(e) and 11(f), resulting in a discontinuous and porous oxide surface and improved diffusion of oxygen through these holes. The cross-section morphologies of the composites after oxidation are presented in Fig. 12, and the residual holes could also be clearly observed in the oxide surface of ZS30Z (Fig. 12(c)). And, with the increase of Zr2[Al(Si)]4C5 content, the thicknesses of the oxidation layers increased. Therefore, based on the analysis results, the protection capability of the oxide scale for preventing the further oxidation of the substrate decreased with the increase of Zr2[Al(Si)]4C5 content, which was in agreement with the analysis results of the oxidation kinetics.
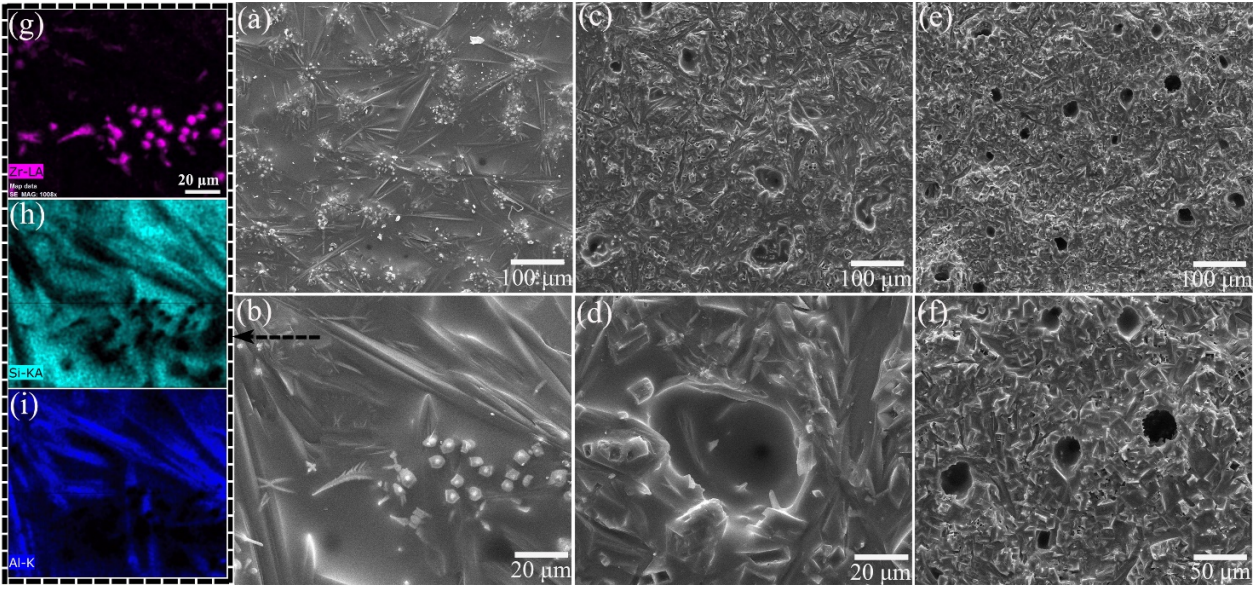
Fig. 11 Surface morphologies of (a, b) ZS10Z, (c, d) ZS20Z, and (e, f) ZS30Z oxidized at 1600 ℃ for 1 h, and (g–i) the EDS maps of (b).
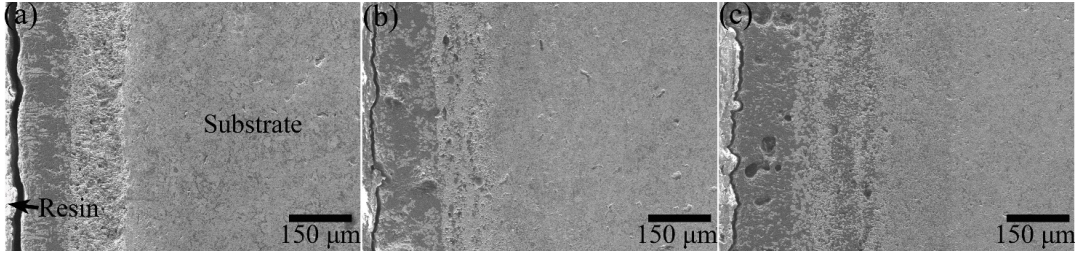
Fig. 12 Cross-sectional morphologies of (a) ZS10Z, (b) ZS20Z, and (c) ZS30Z oxidized at 1600 ℃ for 1 h.
3.4.3 Oxidation mechanism
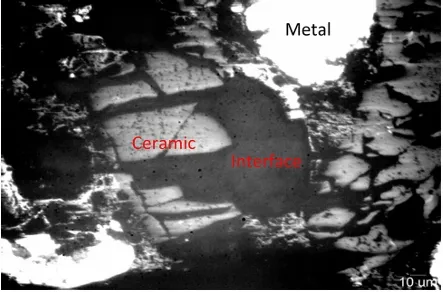
The SEM morphologies and corresponding EDS results of the cross-sections of representative ZS20Z oxidized at 1600 ℃ for 1 h are shown in Fig. 13. As presented in Fig. 13(a), the oxide layer on the substrate displayed a three-layer structure, in which the oxide layer interfaces were clearly shown in Fig. 14. It could be observed that the outer layer and the inner layer were dense, while the middle layer seemed to be loose and porous. The EDS mapping results showed that all the elements had different distributions in different oxide layers. The oxygen content shown in Fig. 13(d) was reduced from the outer oxide layer to the middle layer and then to the inner layer. This was corresponding to the three-layer structure of the oxide scale in Fig. 13(a). Zr element seemed more accumulated in the middle and inner layer, while more Al element existed in the outer layer. Si element was depleted from the middle layer. Although the detection signal of C was weak due to the detection limit of the instrument, it could still be observed that there was C residue in the middle and inner oxide layer, of which the signal intensity was equivalent to that recorded in the substrate.
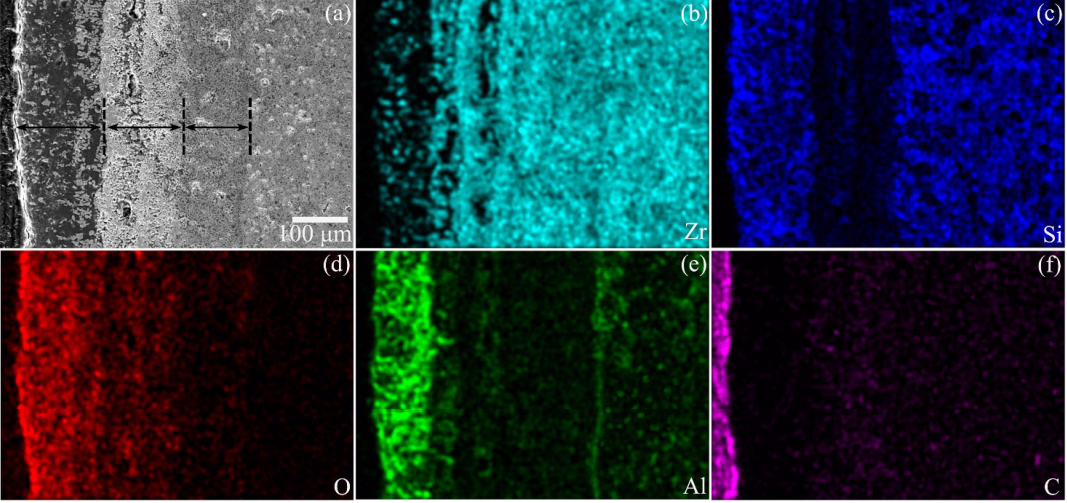
Fig. 13 Cross-sectional morphologies and the corresponding EDS maps of ZS20Z after oxidation at 1600 ℃ for 1 h. The arrows in (a) show the three-layer structure of the oxide scale.
Based on the obtained results, it could be inferred that ZrO2, SiO2, and Al2O3 were formed and covered the substrate immediately by Reaction (4). And then, aluminosilicate was produced by the reaction of SiO2 and Al2O3, i.e., Reaction (5). Thus, the four main phases formed a primary outer layer on the surface in the initial oxidation stage. With the continuously inward diffusion of O2, the substrate covered by the oxide scale was further oxidized. Zr2[Al(Si)]4C5 seemed to be oxidized first in the inner layer according to the EDS mappings. Zr and Al were oxidized to ZrO2 and Al2O3, respectively. Si could be oxidized to SiO by active oxidation [38,44], and residual C was formed due to the relatively low oxygen concentration, which was caused by the inward diffusion of O2 through the oxide surface at high temperatures. Therefore, the main oxidation in the inner oxide layer could be described as follows:
Zr2[Al3.56Si0.44]C5 + 4.89O2 →2ZrO2 + 1.78Al2O3 + 0.44SiO↑ + 5C (8)
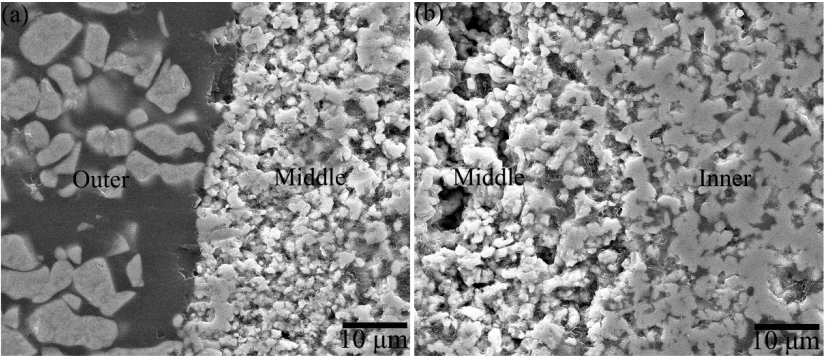
Fig. 14 SEM images of the oxide interfaces between (a) outer and middle layer and (b) middle and inner layer for ZS20Z after oxidation at 1600 ℃ for 1 h.
Thus, the inner layer mainly consisted of ZrO2, Al2O3, C, and unreacted ZrB2 and SiC. With further oxidation, unreacted ZrB2 and SiC were oxidized to form a Si-depleted layer through the following reactions [38,41,43]:
ZrB2 + 2.5O2 → ZrO2 + B2O3↑ (9)
SiC + 0.5O2 → SiO↑ + C (10)
The middle oxide layer mainly consisted of ZrO2, Al2O3, and C covered the newly-formed inner oxide layer. However, the formation of little SiO2 could be observed in the middle layer, which was due to that SiO diffused outward could be further oxidized [42]:
SiO + 0.5O2 → SiO2 (11)
Additionally, Al2O3 could move toward the outer layer together with SiO2 by forming aluminosilicate with lower viscosity [45]. Thus, a porous middle scale was formed, which provided an easy path for the inward diffusion of O2. During the transfer of Al2O3 and SiO2 toward the outer layer, SiO2 could also react with ZrO2 to form ZrSiO4. Besides the reaction consumption, a part of SiO2 on the surface could volatilize through Reaction (7). Additionally, coarsening ZrO2 grains could be seen in the outer layer, which could be due to the formed aluminosilicate with lower viscosity promoting the mobility and growth of ZrO2 particles [45]. Ultimately, an oxide scale with a three-layer structure was formed on the substrate, which was displayed in Figs. 13(a) and 14. Based on the above analysis results, its oxidation sketch is also illustrated in Fig. 15.

Fig. 15 Oxide structure model of ZrB2–SiC–Zr2[Al(Si)]4C5 during oxidation at 1600 ℃.
4 Conclusions
Novel ZrB2–SiC–xZr2[Al(Si)]4C5 UHTCs with relative densities ˃ 99% were successfully obtained via reactive hot-pressing at 1850 ℃ in Ar. With the introduction of Zr2[Al(Si)]4C5 into ZrB2–SiC, the composites showed good mechanical properties, especially improved strength and toughness, e.g., 706 MPa and 7.33 MPa·m1/2, respectively, coupled with Vickers hardness of 21.3 GPa, and Young’s modulus of 452 GPa. In-situ formed SiC and Zr2[Al(Si)]4C5 constituted an effective binary reinforcing system with different scales and morphologies, which showed synergistic strengthening and toughening effects including grain refinement, grain pull-out, crack branching, bridging, and deflection. Additionally, the oxidation behavior of the composites at 1600 ℃ was investigated. According to the relationship between the oxidation weight gain or the thickness of oxide scale and the time, it showed that the oxidation kinetics of all the prepared composites followed the parabolic law, and the composites showed degraded oxidation resistance with the increase of Zr2[Al(Si)]4C5 content. The formation and evolution model of the oxide scale was also given, and the oxide scale exhibited a three-layer structure, i.e., a dense outer layer, a porous middle layer, and a dense inner layer. The obtained results in this paper can provide a basis for the preparation and properties of UHTCs.
References: omitted
Declaration: This article is provided by CERADIR™ users or obtained from Internet, the content does not represent the position of CERADIR™. We are not responsible for the authenticity/accuracy of the article, especially the effects of the products concerned. This article is for study only, it does not constitute any investment or application advice. For reprinting, please contact the original author. If it involves the copyright and/or other issues, please contact us and we will deal with it asap! CERADIR™ has the interpretation of this declaration.