Abstract: In this paper, Zr2SB ceramic with purity of 82.95 wt% (containing 8.96 wt% ZrB2 and 8.09 wt% zirconium) and high relative density (99.03%) was successfully synthesized from ZrH2, sublimated sulfur, and boron powders by spark plasma sintering (SPS) at 1300 °C. The reaction process, microstructure, and physical and mechanical properties of Zr2SB ceramic were systematically studied. The results show that the optimum molar ratio to synthesize Zr2SB is n(ZrH2):n(S):n(B) = 1.4:1.6:0.7. The average grain size of Zr2SB is 12.46 µm in length and 5.12 µm in width, and the mean grain sizes of ZrB2 and zirconium impurities are about 300 nm. In terms of physical properties, the measured thermal expansion coefficient (TEC) is 7.64×10⁻⁶ K−1 from room temperature to 1200 °C, and the thermal capacity and thermal conductivity at room temperature are 0.39 J·g−1·K−1 and 12.01 W·m−1·K−1, respectively. The room temperature electrical conductivity of Zr2SB ceramic is measured to be 1.74×10⁶ Ω−1·m−1. In terms of mechanical properties, Vickers hardness is 9.86±0.63 GPa under 200 N load, and the measured flexural strength, fracture toughness, and compressive strength are 269±12.7 MPa, 3.94±0.63 MPa·m1/2, and 2166.74±291.34 MPa, respectively.
Keywords: Zr2SB; spark plasma sintering (SPS); reaction path; microstructure; properties
1 Introduction
Mn+1AXn (MAX) phase (n = 1–3) is a kind of ternary layered compounds, in which the M element is the early transition metal, the A element is the main group element (12–16), and the X element is B, C, or N. MAX phase was first proposed by Jeitschko et al. [1] in the 1960s. Barsoum [2] synthesized the bulk Ti3SiC2 ceramics through hot pressing and reported on a range of unique properties including high thermal conductivity, high flexural strength, high fracture toughness, excellent machinability, etc. These excellent properties [2–4] are attractive to researchers to conduct extensive researches. So far, more than 650 MAX phases have been calculated as thermodynamically stable, but only about 160 MAX phases have been successfully synthesized [5,6].
Most recently, boron has been found to be an X element of MAX phase. It should be noted that MAX phase boride is not MAB phase. According to the first-principles calculation, the MAX phase boride has a typical MAX phase structure that the M6B octahedral layers are interleaved with the A element layers [3,7], while the M6B unit in the MAB phase has a completely different structure of trigonal prism. Both MAB phase and MAX phase have layered structure, but their atomic structure and bonding are different. Especially, there are B–B bonds in the MAB phase, but not in the MAX phase. The known MAB phases include MAlB (M = Mo, W) phase, M2AlB2 (M = Mn, Cr, Fe) phase, M5Si3Bx (M = Cr, Hf) phase [8–10], etc. Like MAX phase, MAB phase also has a series of interesting properties.
Most initial studies of MAX phase boride started from the corresponding carbide MAX phase. Chakrabotry et al. [7] simulated the properties of V2AlC–V2AlB and judged that the introduction of boron can effectively enhance the ductility. At present, there are mature studies on the synthesis, characterization, and calculation of M2SC (M = Ti, Zr, Nb, Hf) [11–21]. Based on the research of M2SC, Ali et al. [22] simulated the lattice structure and physical properties of M2SC and M2SB (M = Zr, Hf, Nb), identified that M2SB phases have dynamical stability, and revealed the application prospect of Zr2SB in reducing solar absorption coating. Rackl et al. [23,24] were the first to synthesize the MAX phase Nb2S(B,C) and Nb2SB powders by solid phase reaction methods and applied similar processes to synthesize Hf2SB and Zr2SB phases. They reported that the substitution of boron for carbon could increase the cell size and reduce the deformation of Nb6(B,C) octahedron. Qin et al. [25] successfully synthesized compact and pure Nb2SB for the first time and tested a series of mechanical and physical properties.
To date, the literature on MAX phase boride, especially M2SB phase has focused mainly on crystal structure, electron distribution, and physical properties, and little is known about the mechanical strength. To tackle this void, dense Zr2SB ceramic was rapidly prepared by spark plasma sintering (SPS) and explored a series of physical and mechanical properties.
2 Experimental procedure
This experiment used commercial zirconium hydride (99.9% purity, 300 mesh) (Naiou Nano-technology Co., Ltd., China), sublimated sulfur (99.9% purity, 200 mesh) (Wanyu Pharmaceutical Co., Ltd., China), and boron (99% purity, 5 μm) (ENO High Tech Material Development Co., Ltd., China) as the initial powders. The powder mixtures with different amount of substance ratio were weighed on an electronic scale (accurate to 10-4 g) and ball-milled on a rotating machine at 50 r/min for 12 h. These powder mixtures were loaded into a Ø20 mm cylindrical graphite mold and sintered in an SPS furnace (SPS-20T-10, Chenhua Technology Co., Ltd., China) at preset heating rate and pressure. In this preset sintering step, the heating rate below 700 ℃ was set as 50 ℃/min and the pressure was set as 20 MPa; the heating rate above 700℃ was set as 10 ℃/min and the pressure was set as 30 MPa. After sintering, the sample was cooled to 900℃ at a rate of 50 ℃/min and then cooled with the furnace.
The phase composition was determined by X-ray diffractometer (D8 Advance, Bruker, Germany) with a Cu Kα radiation (λ = 1.54178×10⁻¹⁰ m) source and the scanning speed was set to 0.02 (°)/step. The fracture surface of bulk Zr2SB ceramic was observed by a field emission scanning electron microscope (Apreo 2C, Thermo Fisher Scientific, Czech Republic). Energy dispersive spectroscope (EDS) was also used to determine the composition of fracture surfaces.
The thermal expansion coefficient (TEC) was tested in argon environment using a thermal expansion analyzer (L75HD1600C, Netzsch, Germany) with a temperature range of 200–1200℃ and a heating rate of 5 ℃/min. The sample size was 4 mm × 4 mm ×15 mm. The thermal properties were tested in vacuum with a laser thermal conductivity meter (LFA467, Netzsch, Germany) in the temperature range of 25–1200 . The sample size was Ø12.5 ℃ mm × 3 mm. The conductivity of Zr2SB was measured at room temperature by a resistivity tester (FT-300A1, Ningbo Rooko Instrument Co., Ltd., China) with a sample size of 1 mm × 1 mm × 10 mm.
Vickers hardness of Zr2SB ceramic under 1–200 N loads was tested by a micro-hardness tester (HVS-1000ZA, Wanheng Corp., China and HVS-50, Lianer Corp., China) and measured five times for each load point. The indent under the load of 200 N was observed by scanning electron microscopy (SEM). The flexural strength, fracture toughness, and compressive strength of Zr2SB ceramic were tested by a universal testing machine and the sample sizes were 1.5 mm × 2 mm × 18 mm (GB/T 6569-2006), 2 mm × 4 mm × 18 mm (GB/T 23806-2009), and 2 mm × 2 mm × 4 mm (GB/T 8489-2006). The flexural strength was obtained by the three-point bending method, and the fracture toughness was obtained by single-edge notched beam (SENB) method with the notch of 2 mm in length and 0.3 mm in width. The span of flexural strength experiment and fracture toughness experiment was set to 16 mm. The cross-head speed in the three mechanical properties was set to 0.5 mm·min-1.
3 Results and discussion
3. 1 Reaction process
To study the reaction process, this work used commercial purchased zirconium hydride, sublimated sulfur, and boron powders as initial materials to investigate the reaction path. It should be pointed out that the reason for choosing ZrH2 as the initial material is that the powder mixtures of zirconium, sulfur, and boron are very easy to undergo self-propagating high-temperature synthesis (SHS) process, resulting in uncontrollable reaction. As the hydride of zirconium, the hydrogen atoms occupy the octahedral gap of zirconium atoms, so it is difficult for sulfur and boron to react with the hydride of zirconium at low temperature, which inhibits the occurrence of SHS process. Figures 1(a)–1(h) are the X-ray diffraction (XRD) patterns of the samples with the molar ratio of n(ZrH2):n(S):n(B) = 2:1:1 obtained by SPS at sintering temperatures of 650, 800, 900, 1000, 1100, 1200, 1300, and 1400 ℃. For ease of analysis, the phase compositions of the samples at each temperature are summarized in Table 1.

Fig. 1 XRD patterns of Zr2SB ceramic with the molar ratio of n(ZrH2):n(S):n(B) = 2:1:1 at different sintering temperatures: (a) 650℃ , (b) 800 ℃ , (c) 900 , (d) 1000 ℃, (e) 1100℃ , (f) 1200℃ , (g) 1300 ℃ , and (h) 1400℃ .
Table 1 Phase compositions of Zr2SB ceramic sintered by SPS at different temperatures

Results show that ZrH2 in the initial material is decomposed into ZrH1.66 below 800℃ , and finally completely decomposed into zirconium at 1000℃ .Sulfides begin to form above 650℃ , and the formed sulfides include Zr0.75S and ZrS0.67. The content of sulfides reaches the maximum value at 900℃ and disappears completely at 1100℃ . The impu rity phases zirconium and ZrB2 coexist at 900℃ . With the increase of temperature from 900 to 1200℃ , the content of zirconium decreased gradually, while the content of ZrB2 increased gradually. Zr2SB also appeared at 900℃ and reached the highest purity at 1200℃ . As the temperature increased from 1200 to 1300℃ , the phase composition was almost the same, but it was observed that the relative density of the samples became higher at 1300℃ . Therefore, it is believed that the most suitable sintering temperature for Zr2SB is 1300℃ . At 1400℃ , the content of ZrB2 increases abnormally. At the same time, it was observed that the metallic shiny solid adhered to the punches of graphite mold, which resulted in the loss of part of the sample. According to the XRD analysis, it is believed that the main component of shiny solid is zirconium. This means that the decomposition temperature of Zr2SB is above 1400℃ .
It should be mentioned that the sublimated sulfur would suffer gasification loss at normal temperature, and the sulfur would also react with the hydrogen released by the decomposition of ZrH2 during heating. The loss of sulfur would result in a portion of ZrB2 and zirconium remained after sintering the powder mixed at standard stoichiometry. Therefore, the sulfur proportion was further adjusted to confirm the appropriate sulfur ratio and the corresponding process under the experimental conditions.
3. 2 Formula modification
According to the reaction path studied above, a holding temperature lower than 800 ℃ can not only increase the formation of zirconium sulfide, but also control the formation of impurities (zirconium boride), thereby improving the purity of the obtained samples. Therefore, sintering temperature was set to 1300 ℃ and kept at 700 for 10 m ℃ in to adjust the proportion of sulfur to explore the most appropriate relative proportion. A series of relative proportions were selected according to the impurity content, and the results are shown in Figs. 2(a)–2(f).

Fig. 2 XRD patterns of Zr2SB samples sintered at 1300 ℃ with different sulfur proportion of n(ZrH2):n(S):n(B): (a) 2:1:1, (b) 2:1.3:1, (c) 2:1.4:1, (d) 2:1.5:1, (e) 2:1.6:1, and (f) 2:1.7:1.
It is obvious that with the increase of sulfur addition, zirconium and ZrB2 in the sample have a significant downward trend and reach the minimum value at n(ZrH2):n(S):n(B) = 2:1.6:1. With the increase of sulfur proportion, the decreasing trend of zirconium and ZrB2 gradually slowed down. This phenomenon is due to the addition of excess sulfur. The increase in the vapor pressure of volatile sulfur in the mold makes the reversible reaction of hydrogen and sulfur more complete, and more sulfur escapes in the form of hydrogen sulfide.
When the proportion was 2:1.7:1, it was observed that when the temperature raised about 300 ℃ , a large amount of gas escaped from the mold, and the furnace vacuum dropped rapidly. This is because the volatile sulfur and hydrogen released by the decomposition of zirconium hydride make the pressure in the mold too high, and the gas escapes from the gap of the mold. As a result, the sulfurs involved in the reaction decrease and the content of zirconium and ZrB2 in the sample increase abnormally.
Based on the results of these experiments, it can be confirmed that zirconium sulfides play an important role in the formation of Zr2SB and the loss of sulfur is the main reason for the existence of impurity phases ZrB2 and zirconium. As a rapid sintering method, SPS [26–31] can control the escape of sulfur and purify samples as much as possible, but the sintering of Zr2SB is still difficult. In our experiment, the best relative ratio of sulfur under these experimental conditions was 1.6. However, since there are still a large amount of zirconium and ZrB2 in the sample, we would like to adjust the ratio of zirconium and boron to obtain higher purity samples.
To further purify the sample, the formula of zirconium was first adjusted. Under the condition of a sintering temperature of 1300℃ and relative sulfur ratio of 1.6, the results obtained by adjusting the addition amount of ZrH2 are shown in Figs. 3(a)–3(f).
Figure 3 depicts the gradual decrease of zirconium in the sample as the content of ZrH2 decreases. Specifically, when the relative ratio of ZrH2 is 1.6, the peak of zirconium almost disappears. When the relative ratio of ZrH2 is 1.5, the peak of zirconium disappears completely, and the peak of ZrS0.67 appears. The simultaneous existence of ZrS0.67 and ZrB2 proves that ZrB2 does not react with zirconium sulfide to form Zr2SB, which is an impurity phase generated during the reaction. This also indicates that zirconium sulfide may be an ideal precursor of Zr2SB, but due to the limited experimental conditions, this method has not been applied in this paper. Meanwhile, the content of ZrB2 increases obviously with the decrease of ZrH2. This is because the excess of boron leads to a strong tendency to form ZrB2. Therefore, the boron proportion was further adjusted based on the molar ratio of n(ZrH2):n(S):n(B) = 1.6:1.6:1.

Fig. 3 XRD patterns of Zr2SB samples sintered at 1300 ℃ with different ZrH2 proportion of n(ZrH2):n(S):n(B): (a) 2:1.6:1, (b) 1.9:1.6:1, (c) 1.8:1.6:1, (d) 1.7:1.6:1, (e) 1.6:1.6:1, and (f) 1.5:1.6:1.
It can be seen from Fig. 4 that the ratio of zirconium hydride to boron has a great impact on the purity of the sample, and the best molar ratio of n(ZrH2):n(B) is 2:1. Therefore, the adjustment of these two raw materials was coordinated, and finally obtained the purest sample with n(ZrH2):n(S):n(B) = 1.4:1.6:0.7. The XRD data of the obtained samples are shown in Fig. 5, and the pattern is similar to that obtained by Rackl and Johrendt [24]. In present work, the broader diffraction peaks of Zr2SB are probably associated with the finer grain size. Based on their work, zirconium was further incorporated into the Rietveld refinement, which is shown in Fig. 5. According to the Rietveld refinement results, the sample is composed of 82.95 wt% Zr2SB, 8.96 wt% ZrB2, and 8.09 wt% zirconium.

Fig. 4 XRD patterns of Zr2SB samples sintered at 1300℃ with different boron proportion of n(ZrH2):n(S):n(B): (a) 1.6:1.6:1, (b) 1.6:1.6:0.9, (c) 1.6:1.6:0.8, (d) 1.6:1.6:0.7, and (e) 1.6:1.6:0.6.

Fig. 5 Comparison between the observed (black cross) and calculated (red curve) XRD patterns of Zr2SB ceramic. The blue curve represents the difference between the observed and calculated XRD patterns. Green, purple, and pink marks are the peak positions of Zr2SB, ZrB2, and zirconium, respectively.
The crystallographic data of Zr2SB are listed in Table 2. The lattice constants obtained in this paper for Zr2SB are a = b = 3.52084×10⁻¹⁰ m and c = 12.30501× 10⁻¹⁰ m, which are close to the data in the literature [24].
Table 2 Crystallographic data of Zr2SB ceramic

3. 3 Microstructure characterization
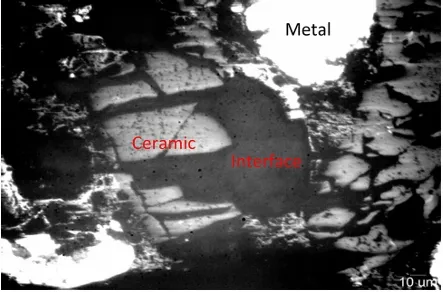
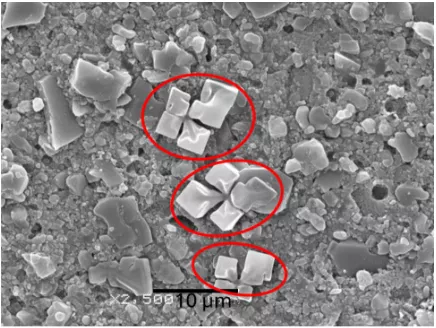
The density of Zr2SB sample measured by the Archimedes’ method is 6.13 g·cm-3, and the theoretical density including impurity content is 6.19 g·cm-3, corresponding to the densification of 99.03%. Figure 6 is the SEM image and the EDS results of the flexural fracture surface of Zr2SB. The EDS results confirm that the n(Zr):n(S) ratio of the larger grain in this sample is about 1.85, which is within the allowable error range. Thus, it is believed that the larger grain in the sample is Zr2SB. 30 crystal grains with clear boundaries on the concave fracture surface were selected for grain size calculation. The grain size of Zr2SB is larger than that of Nb2SB (6 μm in length and 3.6 μm in width) sintered with SPS, with an average length of 12.46 μm and an average width of 5.12 μm. The impurity phases ZrB2 and zirconium are distributed at the grain boundaries of lath shaped Zr2SB.

Fig. 6 SEM images of flexural fracture surface of Zr2SB ceramic: (a) concave fracture surface and (b) convex fracture surface; (c) EDS result of Zr2SB grains.
Intergranular and transgranular fracture occurred in Zr2SB grains. Many transgranular fractured Zr2SB grains with obvious layered characteristics can be observed on both concave and convex fractures. Meanwhile, pits left after the grains fall off due to intergranular fracture can be observed on the concave fracture, and the corresponding detached complete grains can be observed on the convex surface. Intergranular fracture exists in the ZrB2 and zirconium impurity grains. And due to the low strength of the impurity grain boundary, the cracks expand rapidly at these positions, resulting in that the bending strength and fracture toughness test results of this sample will be slightly lower than the actual values.
3. 4 Physical property evaluation
The red curve in Fig. 7 is the thermal expansion curve of Zr2SB measured at 25–1200 ℃, and the black line is the result of linear fitting. The equation is αTEC,1200 ℃= –0.01147+0.00078337T with the R-square of 0.99417. The average TEC of Zr2SB is calculated as 7.64×10⁻⁶K-1, which is between those of Zr2SC (8.8×10⁻⁶ K-1) [21] and Nb2SB (7.1×10⁻⁶ K-1) [25].

Fig. 7 Thermal expansion (red curve) and linear fitting result (black straight line) of Zr2SB ceramic at 25−1200℃ .
Figure 8 is the temperature dependence of thermal diffusivity. The thermal diffusion coefficient increases from 4.97 mm²·s-1 at room temperature to 7.29 mm²·s-1 at 1200℃. Compared with Nb2SB, the thermal diffusion coefficient of Zr2SB is smaller in the same temperature range, and maintains at a very low value. Figure 9 shows the temperature dependence of thermal conductivity and heat capacity of Zr2SB ceramic sintered by SPS. The thermal conductivity of Zr2SB increases rapidly from 12.0 W·m-1·K-1 at room temperature to 30.7 W·m-1·K-1 at 800℃ . As the temperature continues to rise, the change trend slows down obviously and tends to a constant value of 34.2 W·m-1·K-1 at 1200℃ . The thermal conductivity of Zr2SB at room temperature is lower than those of Nb2SB (13.79 W·m-1·K-1) [25]and Zr2SC (38 W·m-1·K-1at 100 ℃) [21]. However, as the temperature increases, the thermal conductivity of Zr2SB (16.7 W·m-1·K-1) exceeds that of Nb2SB at 200 (15.0 W·m ℃ -1·K-1). At high temperature, the thermal conductivity of Zr2SB (34.2 W·m-1·K-1 at 1200℃ ) is very close to that of Zr2SC (34.6 W·m-1·K-1 at 1200℃ ). Similarly, the heat capacity of Zr2SB increases rapidly from 0.39 J·g-1·K-1 at room temperature to 0.73 J·g-1·K-1 at 600℃ , and then slowly increases to a constant value of 0.78 J·g-1·K-1 at 1200℃ . At room temperature, the heat capacity of Zr2SB is lower than that of Zr2SC (0.48 J·g-1·K-1), while at about 400℃ , the heat capacity of Zr2SB (0.58 J·g-1·K-1) exceeds that of Zr2SC (0.53 J·g-1·K-1). Also, at high temperatures, the heat capacity of Zr2SB (0.78 J·g-1·K-1 at 1200℃ ) is significantly higher than that of Zr2SC (0.50 J·g-1·K-1 at 1000 ℃). Compared with Zr2SB and Zr2SC, the heat capacity of Nb2SB is relatively low (0.36 J·g-1·K-1 at room temperature and 0.49 J·g-1·K-1 at 800 ).

Fig. 8 Thermal diffusivity of Zr2SB ceramic measured from 20 to 1200℃ .

Fig. 9 Thermal conductivity and thermal capacity of Zr2SB ceramic measured from 20 to 1200℃ .
In addition, the room temperature electrical conductivity of Zr2SB ceramic is measured to be 1.74×10⁶ Ω-1·m-1, which is nearly 50% higher than the room temperature electrical conductivity of Nb2SB (1.17×10⁶ Ω-1·m-1), and slightly lower than the room temperature electrical conductivity of Ti2SC (1.85×10⁶ Ω-1·m-1) [12]. As zirconium is located on the left side of niobium in the periodic table, it has stronger metallicity, which also leads to better conductivity of Zr2SB than that of Nb2SB. Compared with Ti2SC, zirconium has stronger metallicity than titanium, but Zr–B bond has covalent properties to some extent, which results in lower conductivity of Zr2SB [24].
3. 5 Mechanical property evaluation
Table 3 lists a series of physical and mechanical properties of Zr2SB sintered by SPS, and compares these properties with that of Nb2SB[25] and Zr2SC[21] sintered by the same method. For more details, the measured flexural strength of Zr2SB is 269±12.7 MPa, which is higher than that of the same type of Nb2SB 249±17 MPa, close to that of Zr2SC 275±10 MPa, and much lower than that of Ti2SC (394 MPa) [14]. The fracture toughness of Zr2SB is 3.94±0.63 MPa·m1/2, slightly lower than those of Nb2SB 4.76±0.36 MPa·m1/2 and Ti2SC (5.4 MPa·m1/2). In addition, the measured compression strength of Zr2SB samples is 2166.74± 291.34 MPa, which is much higher than those of Nb2SB (1157±73 MPa) and Ti2SC (736 MPa) sintered by SPS. This is because that a large number of small grained ZrB2 and Zr impurities at the grain boundary hinder the sliding of Zr2SB grains and increase the compressive strength of the sample. Nevertheless, its compressive strength is still much higher than that of conventional MAX phases, thus performing good compression performance.
Table 3 Comparison of physical and mechanical properties of Zr2SB, Nb2SB, and Zr2SC ceramics

Figure 10 depicts the relationship between the hardness of Zr2SB and the indentation load. The Vickers hardness is 14.39±0.43 GPa at 1 N load. As the pressure increases, the hardness gradually decreases and reaches 9.86±0.63 GPa at 200 N load. At a load of 10 N, the hardness of Zr2SB is 12.55±0.72 GPa, which is higher than that of Nb2SB (11.89±0.37 GPa), Zr2SC (6.4 GPa), and Ti2SC (6.7 GPa). As shown in Fig. 10, due to the high hardness and low fracture toughness of Zr2SB, cracks appear at the four corners of the indent. The overall indentation is complete without grain extrusion, and there are no crack extensions at the four corners which will affect the indentation size. Therefore, Zr2SB, due to its high hardness value corresponding to its good mechanical properties, is currently one of the MAX phases that are most promising to develop into functioal–structural ceramics at present.

Fig. 10 Vickers hardness of Zr2SB ceramic as a function of indentation load. The inset shows the SEM image of indent at the load of 200 N.
4 Conclusions
Highly dense boron containing MAX phase Zr2SB was successfully prepared by SPS, and the corresponding reaction process, microstructure, and physical and mechanical properties of the samples were investigated. The following results are obtained:
1) The optimum molar ratio to synthesize Zr2SB is n(ZrH2):n(S):n(B) = 1.4:1.6:0.7 with the process of holding time of 10 min at 700 ℃ and 10 min at 1300 ℃ and 30 MPa. The obtained sample has a purityof 82.95 wt%, a relative density of 99.03%, and mean grain size of 12.46 μm in length and 5.12 μm in width.
2) The average TEC of Zr2SB at 25–1200℃ is 7.64×10⁻⁶ K-1. The thermal diffusivity increases from 4.97 mm²·s-1 at room temperature to 7.29 mm²·s-1 at 1200℃ . The thermal conductivity and heat capacity at room temperature are 12.0 W·m-1·K-1 and 0.39 J·g-1·K-1, respectively. The electrical conductivity at room temperature is determined to be 1.74×10⁶ Ω-1·m-1.
3) The flexural strength, fracture toughness, and compressive strength are determined to be 269±12.7 MPa, 3.94±0.63 MPa·m1/2, and 2166.74±291.34 MPa, respectively. The Vickers hardness is determined to be 9.86±0.63 GPa at 200 N. Excellent physical and mechanical properties give Zr2SB the prospect as a functional–structural ceramic.
References: omitted
Declaration: This article is provided by CERADIR™ users or obtained from Internet, the content does not represent the position of CERADIR™. We are not responsible for the authenticity/accuracy of the article, especially the effects of the products concerned. This article is for study only, it does not constitute any investment or application advice. For reprinting, please contact the original author. If it involves the copyright and/or other issues, please contact us and we will deal with it asap! CERADIR™ has the interpretation of this declaration.