Abstract: Calcium-magnesium-alumino-silicate (CMAS) corrosion is a critical factor which causes the failure of thermal barrier coating (TBC). CMAS attack significantly alters the temperature and stress fields in TBC, resulting in their delamination or spallation. In this work, the evolution process of TBC prepared by suspension plasma spraying (SPS) under CMAS attack is investigated. The CMAS corrosion leads to the formation of the reaction layer and subsequent bending of TBC. Based on the observations, a corrosion model is proposed to describe the generation and evolution of the reaction layer and bending of TBC. Then, numerical simulations are performed to investigate the corrosion process of free-standing TBC and the complete TBC system under CMAS attack. The corrosion model constructs a bridge for connecting two numerical models. The results show that the CMAS corrosion has a significant influence on the stress field, such as the peak stress, whereas it has little influence on the steady-state temperature field. The peak of stress increases with holding time, which increases the risk of the rupture of TBC. The Mises stress increases nonlinearly along the thick direction of the reaction layer. Furthermore, in the traditional failure zone, such as the interface of the top coat and bond coat, the stress obviously changes during CMAS corrosion.
Keywords: thermal barrier coating (TBC); calcium–magnesium–alumino–silicate (CMAS) corrosion; corrosion model; temperature field; stress field
1 Introduction
Thermal barrier coating (TBC) is widely used in gas turbines and aircraft engines to protect the metallic substrates and other engine parts from high-temperature exposure. TBC usually consists of four layers, top coat (TC), thermally grown oxide (TGO, a thin layer formed due to oxidation), bond coat (BC), and substrate (Sub) [1–4]. Ceramic layer consisting of porous 7%–8% yttriastabilized zirconia (YSZ) exhibits excellent thermal insulating performance and shows high resistance to high-temperature corrosion [5]. The YSZ layer is usually deposited by air plasma spray (APS) or electron-beam physical vapor deposition (EB-PVD). APS is a lowcost process depositing the YSZ coating with a parallel layered architecture, and EB-PVD deposits the YSZ coating with a microstructure of vertical columnar grains that increases the strain tolerance due to the intercolumnar porosity [6,7]. However, both techniques show two drawbacks: EB-PVD is rather expensive for wide-scale application, and APS TBC typically has a shorter thermal lifetime. Recently, a novel thermal spray technique has been developed, suspension plasma spraying (SPS), which might be a process combining the advantages of APS and EB-PVD [8]. This low-cost process can lead to the formation of columnar structures or vertical cracks in the TC layer, which improve strain tolerance of the TBC. However, unlike the conventional APS and EB-PVD TBC, the study on the failure mechanism of the SPS TBC is quite limited, such as CMAS attack.
As we all know, there are many factors that may lead to the failure of TBCs. Among them, the calcium–magnesium–alumino–silicate (CMAS) corrosion is believed to be one of the critical factors which causes the failure of TBCs [9–11]. CMAS is a kind of mixed oxides usually coming from sand, runway debris, volcanic ash, air pollution, or fly ash [12–14]. The attack from CMAS, including the impact damage caused by large siliceous debris and erosive wear or local spallation caused by small debris [15–19], will cause corrosion of TBC that deteriorates the performance and shortens the lifetime of TBCs. The studies showed that the siliceous particles could penetrate into TBCs due to conspicuous wetting ability when the temperature in TBCs is higher than the melting point of CMAS [15,20,21], deteriorating the thermal insulating performance and increasing the stiffness of TBCs. Moreover, YSZ is partially dissolved by CMAS, resulting in a microstructure degradation and phase transformation [22]. Both these two failure mechanisms are caused by high temperature and concentration of stress, which will possibly trigger the catastrophic failure of TBCs during their service. Therefore, it is necessary to study the evolution of temperature and stress fields of TBCs under CMAS attack.
Several studies focused on the chemical reaction mechanism of CMAS and YSZ and the evolution of microstructures of TBCs after the CMAS attack, which was the basis of further studies. Graces et al. [23] studied the corrosion process of CMAS in TBCs. The results proved that molten CMAS dissolutes the YSZ coating at elevated temperatures, and then upon saturation, re-precipitation of several crystalline phases closer to equilibrium with the melt, which is the primary mechanism of interaction among corrosion process, resulting in the generation of reaction layer or corrosion area. The mechanism of buckling of APS TBC under CMAS attack was particularly elucidated [24,25] . Firstly, CMAS becomes soft (around 764℃ ) and molten (around 1250℃ ), and infiltrates into pre-existing cracks and pores due to the capillary force drives. Additionally, CMAS separates inter- or intrasplat boundaries so that the volume of coating tends to increase. The expansion introduces compressive stress since the top coat is physically constrained by the substrate, which leads to buckling to release compressive stress. The whole buckling process occurs at high temperatures. During the cooling process, CMAS solidifies gradually and the buckling shape is fixed; however, the changes due to the thermal expansion coefficient mismatch which tends to increase the bending.
It is well known that the failure caused by stress usually appeared during cooling. Chen [26] and Krämer et al. [27] studied the delamination mechanism of TBCs during cooling, which confirmed that thermal mismatch between corroded ceramic coating, metallic substrate, and corrosion area generated compressive stress in the coating. However, the distribution and evolution of stress of TBCs under CMAS attack is also crucial at high temperatures. Xu et al. [24] established constitutive equations for TBCs under CMAS infiltration and corrosion. Similarly, they observed the bending of free-standing TBC at high temperatures and defined a specific parameter named coefficient of corrosion expansion to describe the volume expansion of coating under CMAS attack.
The dynamic evolution of the temperature and stress fields caused by the CMAS attack is challenging to trace, limiting the accurate analysis and prediction of the service life of TBCs. Up to now, few pieces of studies on the mechanism of buckling of SPS TBCs, and the temperature and stress fields of TBC under CMAS attack during the whole corrosion process have been reported [28–30]. In this work, a new method has been developed to describe the mechanical behaviors of SPS TBCs under CMAS attack, by combining experiments with numerical simulations.
2 Experimental
2. 1 TBC preparation
All the TBC samples, 30 in total, were deposited on the Ni-base superalloy substrates machined in the form of a “square button” (5 mm in width, 3.65 mm in thickness). TBC (450 μm in thickness) of 7 wt% Y2O3 stabilized ZrO2 was deposited by SPS. The substrates were removed by hydrochloric acid since the metallic substrate can not bear a high temperature above 1150 . The free ℃ -standing TBC without substrate is easy to deform, and then the phenomena such as bending and rupture, can be clearly observed. Therefore, freestanding TBC samples were used to study the corrosion process, which meant that the influence of substrate during CMAS corrosion was ignored.
2. 2 CMAS preparation
The CMAS is mainly composed of CaO, MgO, Al2O3, and SiO2, with a varied component ratio. This study adopted a component ratio of 33:9:13:45 (CaO: MgO:Al2O3:SiO2, in mole percentage) [31]. These four oxides were mixed with deionized water and wet grinded for 20 h to form the homogenous powder. The mixture was dried for 12 h at 120 ℃ in the oven and then dry grinded for 4 h. The powder, set in a platinum crucible, was heated for 4 h at 1400 ℃ in the muffle furnace and then cooled down to room temperature to obtain the CMAS glass. The CMAS glass was milled into a fine powder with mortar and pestle, and then sieved by a 500 mesh. The milled CMAS was mixed with ethanol to produce a thick paste and then deposited on the TBC.
2. 3 CMAS corrosion experiments
The experimental group (TBC with CMAS) and control group (TBC without CMAS) were set in the experiments respectively. In the experimental group, the TBC was coated with a uniform layer of CMAS paste by brushing and drying to achieve a CMAS loading of 25 mg/cm². Corrosion experiments were conducted in a muffle furnace at a temperature of 1400℃, which is set similarly with Ref. [32]. The heating rate was 5 ℃/min with an annealing time of 0, 4, 8, 12 and 24 h; and then, the samples were cooled down to room temperature in static air. The samples were embedded in epoxy for 10 h after the corrosion experiments and then cut to obtain cross- sections. Scanning electron microscope (SEM, ZEISS EVO10, Germany) was adopted to obtain the micromorphology, and the energy-dispersive spectroscopy (EDS) was utilized to analyze the element distribution in the corrosion zones.
3 Experimental results
3. 1 Bending of free-standing TBC
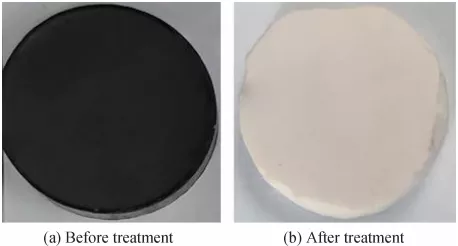
As shown in Fig. 1(a), the TBC sample with CMAS is obviously bended compared with the one without CMAS after heat treatment at 1400℃ for 8 h. Similar results were also observed for different holding time, and further comparison indicated that the bending degree of TBCs increased with heating time. Generally, the infiltration of CMAS caused a mismatch of thermal expansion coefficients between infiltrated and noninfiltrated layers, which further caused the curvature of the coating to change during cooling. As already clarified, the bending of the coating was not mainly due to the thermal expansion mismatch of the TBC after cooling but the infiltration of CMAS, due to CMAS separate inter- and intra-splat boundaries of YSZ grain at high temperatures [25]. Here, similar results were found within free-standing SPS TBC, as illustrated in Fig. 2. As shown in Fig. 2(a), EDS analysis exhibits the major element composition of the coating after CMAS attack. There are two different prominent parts. From the Al element map, it is obvious that the CMAS is concentrated on the top layer. The microstructure in the top layer is obviously different from the bottom layer. From the Zr element map, it is clear that the amount of Zr in the top layer reduced. A higher magnification image (Fig. 2(b)) indicates that CMAS (indicated by Mg) penetrated between the ZrO2 grains. This confirmed that the ZrO2 grains were separated by CMAS, which induced the volume expansion of the reaction layer. The bending degree of TBC over time was also recorded in the experiments and further analyzed in Section 3.3. In Section 4.1, the results will be used to develop the corrosion model.
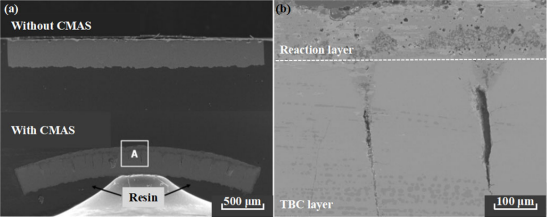
Fig. 1 (a) Cross-sectional images of the TBC after heat treatment at 1400℃ for 8 h without and with CMAS and (b) the micromorphology with higher resolution of area A.

Fig. 2 EDS images of (a) TBC and (b) reaction layer after heat treatment at 1400℃ for 12 h with CMAS .
3. 2 Generation of the reaction layer
The difference of micro-structural and the distribution of elements between the reaction layer and unreacted layer have been described in the previous section. As shown in Fig. 1(b), the color of the top layer is darker than the others. Furthermore, the element distribution also exhibits the distinction between the two layers. As illustrated in Fig. 2(a), the elements of CMAS concentrate on the top layer of TBC, and these element distribution maps indicate that the area is corroded by CMAS. Many studies have proved that the reaction of CMAS and TBC happened in the corroded zone [23,24,26,33]. Therefore, in this paper, the corroded zone of TBC is defined as the reaction layer. It should be noted that the reaction layer thickness continuously increases with the heat preservation time. And the values were recorded in experiments, which would be further studied in Section 3.3.
3. 3 Relationship between the reaction layer thickness and bending degree
Experimental results confirmed that the bending and the reaction layer generated in the free-standing TBC under CMAS attack. The experimental data are fitted by two empirical equations, i.e., Eqs. (1) and (2), respectively.
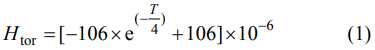

where Htor denotes the reaction layer thickness, Hbd denotes the bending degree of TBC, T is the holding time, and e denotes the Euler number.
As shown in Fig. 3(a), the definitions of these two physical quantities are presented. The curvature of the coatings was calculated with Eq. (3).
The reaction layer thickness (Fig. 3(b)) and bending degree of TBC increase with the holding time, and they are presented as a function of holding time, as shown in Figs. 3(c) and 3(d), respectively. It should be noted that all the data plotted are the average values measured form SEM images. Therefore, in Section 4, the results are used to construct a simplified corrosion model to describe the complex process of CMAS attack.

Fig. 3 (a) Definition of physical quantities, (b) the thickness of the reaction layer at different holding time, (c) the reaction layer thickness and (d) the bending degree of TBC as a function of holding time.
4 Numerical modeling
Experimental analysis and numerical modeling are combined to study the temperature and stress fields of TBC (with BC and Sub) under CMAS attack. Firstly, a corrosion model of the CMAS attack is developed based on the experimental results. Next, a numerical simulation of the free-standing TBC is performed to determine the parameter of volume expansion rate for further simulation. Finally, a numerical model of a complete TBC system (with BC and Sub) is constructed to obtain temperature and stress fields during CMAS corrosion. All numerical simulations are performed with the software ABAQUS 6.14.
4. 1 Corrosion model under CMAS attack
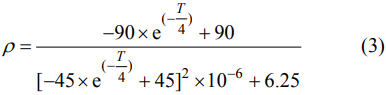
As shown in Fig. 4, the corrosion process is simplified. In the beginning, CMAS is located on the top of TBC as a thin layer. When the temperatures are above the melting point of CMAS, molten CMAS infiltrates into the pores or cracks and reacts with the TBC. Subsequently, the reaction layer generates on the top of TBC, and the volume of the layer also expands. Therefore, CMAS corrosion process can be simplified as the generation and growth of the reaction layer, as well as the expansion of this layer. For precisely describing the processes, the reaction layer was divided into a number of sub-layers to simulate the increase of the reaction layer thickness in a short time interval. The transformation from the top of TC layer to the reaction layer is considered as the change of material properties, which mainly includes Young’s modulus, thermal conductivity, the coefficient of thermal expansion, and poisson ratio. For clearly describing the volume expansion of the reaction layer, a volume expansion rate is also introduced to describe the reaction layer’s expansion under CMAS attack, which is similar to the coefficient of corrosion expansion defined by Xu et al. [24].
Fig. 4 Corrosion model of TBC for CMAS corrosion.
4. 2 Numerical model of free-standing TBC
As shown in Fig. 5, a numerical model of free-standing TBC with multiple vertical cracks was established to simulate the deformation of TBC under CMAS attack. The loading conditions and boundary conditions are consistent with experimental conditions. A two-dimensional plane strain model is used to simulate the corrosion process and fit the deformation of TBC in experiments. USDFLD is used to simulate the formation of the reaction layer due to the CMAS corrosion. And the expansion of the reaction layer is simulated by UEXPAN, both of which are subroutines within ABAQUS. The length and thickness of the free-standing TBC model are set as 5 mm and 450 μm, respectively. The number and width of cracks are 20 and 5 μm, respectively. The constraint in the y-direction is applied to two base angles of the model. Stress-free conditions are applied to other surfaces. Since the environment is uniform in a muffle furnace, a uniform temperature (1400℃ ) is applied to the whole model with a heating rate of 5 ℃/min.
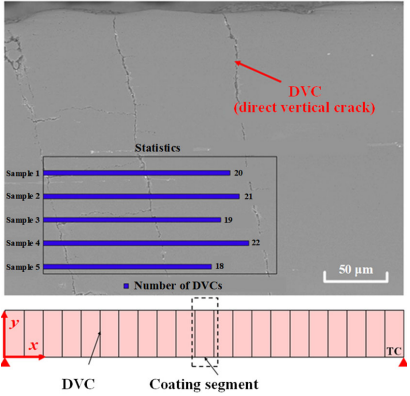
Fig. 5 Illustration of the geometry of free-standing TBC with direct vertical cracks before CMAS corrosion.
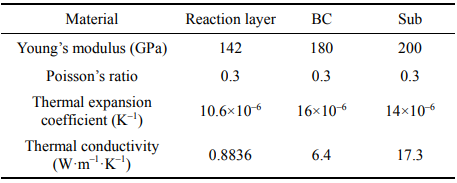
Free-standing TBC was meshed with four-node bi-linear plane strain quadrilateral reduced integration elements (CPE4R). Four materials were defined, i.e., YSZ, pore, CMAS, and the reaction layer. All materials are considered as isotropic, homogeneous, and linear elastic materials [27,30,34–36]. The material parameters are given in Table 1.
Table 1 Material parameters used in the simulation of CMAS attacking the free-standing TBC [27,30, 34–36,39]
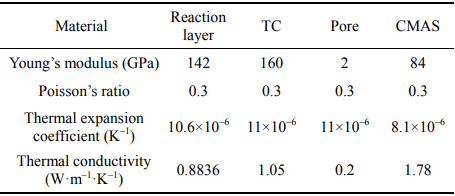
The Young’s modulus and the Poisson’s ratio of the reaction layer are also obtained from numerical simulations. As shown in Fig. 2, CMAS is one of the major compositions of the reaction layer. The composition of the YSZ after CMAS corrosion is consistent with as-sprayed coatings [33]. Therefore, the reaction layer is assumed as a mixture of three materials, i.e., YSZ, CMAS, and pores. The amount of pores of the reaction layer increased under CMAS attack. As illustrated in Fig. 6, SEM images of the reaction layer were collected, and their features were evaluated by object-oriented finite (OOF) elements, which used a plane strain model to calculate the Young’s modulus [37,38]. According to the calculation, the Poisson’s ratio of the reaction layer is about 0.3, and Young’s modulus is 142 GPa. The thermal expansion coefficient of the reaction layer is 10.6×10⁻⁶ K-1 [39].
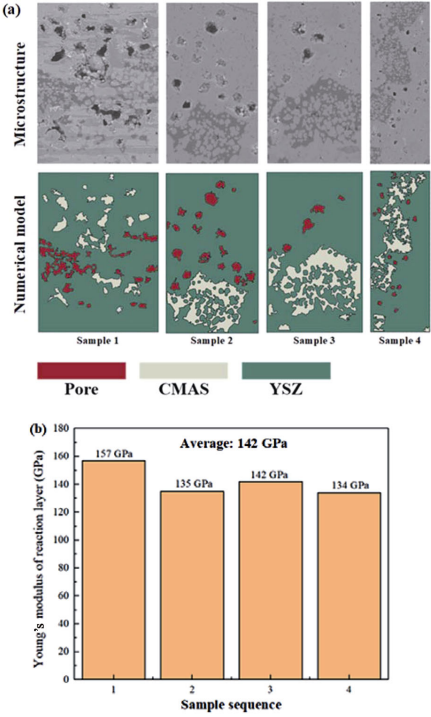
Fig. 6 (a) Micro-structure and composition of the reaction layer for the OOF analysis and (b) the results of Young’s modulus estimated by OOF.
4. 3 Volume expansion rate
The volume expansion rate is a critical parameter that reflects the real-time volume strain of the reaction layer during CMAS corrosion. It is difficult to determine in experiments directly. However, the bending rate of TBC can be obtained by differentiating of Eq. (2). Assuming the expression of the volume expansion rate is similar to the bending rate of TBC due to their physical correlation, the following expression for the volume expansion rate can be obtained:
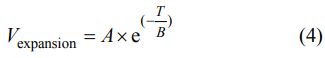
where Vexpansion denotes the volume expansion rate and A and B are constants. The values of A and B were confirmed by the control variable method. Different A or B values were used in Eq. (4) to fit the experimental bending degree of TBC. Eventually, as shown in Fig. 7, the most suitable values of A and B are given in Eq. (5):
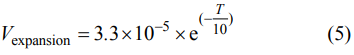
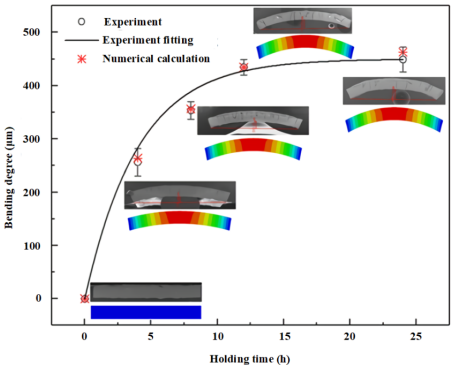
Fig. 7 Experimental and simulated results of bending degree of free-standing TBC model.
4. 4 Numerical model of the complete TBC
As shown in Fig. 8, the complete TBC model includes three layers, i.e., TC, BC, and Sub. The material properties that controlling the corrosion process are consistent with these in the free-standing TBC model. It is assumed that the corrosion process only happened in the holding time. The thickness of BC and Sub are 200 μm and 3 mm, respectively. The length of the considered segment is 115 μm, based on the SEM image shown in Fig. 5. The symmetric boundary condition is applied to the left of the model and the periodic boundary condition on the right. The constraint of the y-direction is applied to two base angles of the model. Stress-free conditions are applied to other surfaces. It should be noted that the direct vertical cracks, which are too small to influence the temperature and stress fields, and the TGO formed during the service, are not considered in the simulations.
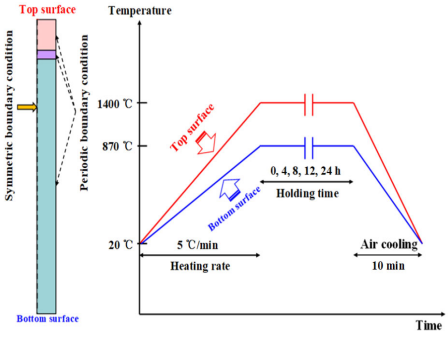
Fig. 8 Illustration of the geometry of TBC before CMAS corrosion and temperature loading of the TBC model.
To be consistent with work conditions, thermal conduction is added to the complete TBC model. Therefore, the calculation adopted a coupled temp-displacement model, which is in a steady state. As shown in Fig. 8, the different temperature boundary conditions are applied to the top and bottom surfaces. TC, BC, and substrate are meshed with four-node plane strain thermally coupled quadrilateral, bilinear displacement, and temperature elements, which are all thermal conductivity of the reaction layer is calculated based on the OOF method and the Fourier heat conduction equation [37,38]. The thermal conductivity becomes smaller when the material transforms from TC to the reaction layer.
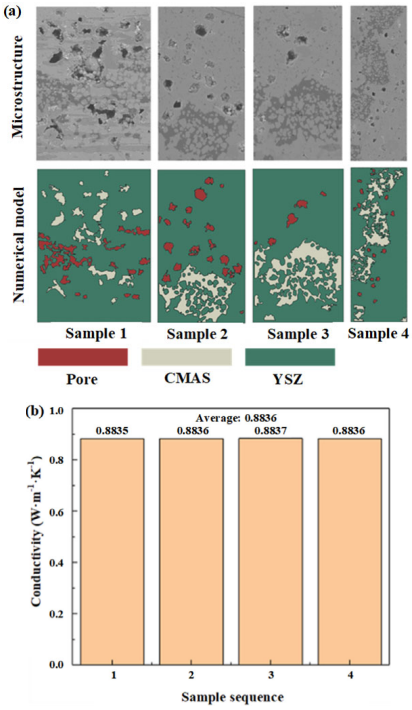
Fig. 9 Calculation of the thermal conductivity of normal TBC.
Table 2 Material parameters used in the simulation of CMAS attacking the complete TBC [27,30,34–36,39]
5 Numerical results and discussion
A systematic exploration of the effects of CMAS corrosion on the temperature and stress fields is essential for a better understanding of the failure mechanisms of TBC under CMAS corrosion.
5. 1 Temperature field of TBC
It is well known that CMAS corrosion changes the material properties of TBC, such as thermal conductivity; as a result, the steady temperature field of TBC should be changed in CMAS corrosion. In this section, as shown in Fig. 10, five different groups of simulations were performed with different conditions to study the steady temperature field affected by CMAS corrosion, in which holding time is set as 0, 4, 8, 12 and 24 h, respectively.
The temperature field of TBC during CMAS corrosion is illustrated in Fig. 10(a), in which the temperature gradient along the thickness direction of TBC is clearly observed. As the holding time increases, there are no obvious changes in the temperature field of TBC, but the zone of low temperature increases slightly. Obviously, the change is relevant to the thermal conductivity of the material system, which is affected by CMAS corrosion.
As shown in Fig. 10(b), the contour map of the blue dashed box is enlarged to further explore the influence of CMAS corrosion on the temperature field. Firstly, the temperature of the corrosion zone is above 1350 ℃ ,which confirms that CMAS is molten in the zone so that it normally reacts with YSZ. Secondly, the top layer exhibits a high ability for thermal insulation. The zone has a complex distribution of temperature, which exists great temperature gradients from top to bottom of the TC layer (decreasing from 1400 to 1000 ℃ ). And the area at the highest temperature in the corrosion zone decreases within holding time, which confirms that the thermal conductivity decreases in the zone.
Path-1, which is figured out by red arrow along the thickness direction in Fig. 10(a), is selected to calculate the specific temperature distribution of TBC. The line chart includes five overlapped lines representing five different holding time, which confirms that CMAS corrosion has a slight influence on the temperature distribution. Furthermore, it confirms that CMAS corrosion has little influence on thermal stress due to the small difference in the thermal expansion coefficient of the TC and reaction layer, at least in this study.
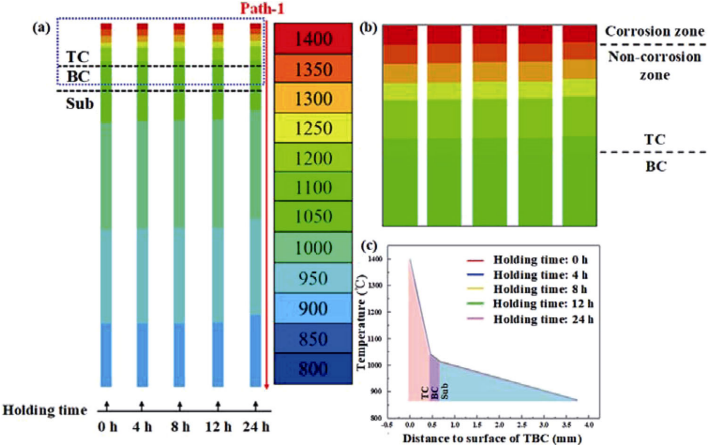
Fig. 10 Distribution of temperature fields of TBC during CMAS corrosion.
Generally speaking, CMAS corrosion decreases the thermal conductivity of the material in the corrosion zone, so that the ability of thermal insulation improves relevantly. However, the thermal conductivity decrease or thermal insulation improvement is too small to affect the temperature distribution. Furthermore, thermal stress is directly relevant to the temperature distribution, so that the thermal stress is not the main factor caused the failure in CMAS corrosion at elevated temperatures.
5. 2 Stress field of TBC
It is of great importance to study the stress field since it reflects the root of TBC failure. In this section, the distribution and evolution of stress fields in TBC during CMAS corrosion, taking 24 h (holding time) as an example, are discussed in detail. As shown in Fig. 11, the stress contour reflects the distribution and evolution of Mises stress, and the principal stress along x-direction in TBC are plotted, respectively. Seven sets of contour maps, which represent the different time during CMAS corrosion, are given to discuss the stress distribution and evolution of TBC.
Mises stress is suitable for estimating the degree of damage as an evaluation criterion. As shown in Fig. 11, there are seven contour maps of stress in Figs. 11(a) and 11(b), respectively. As shown in Fig. 11(a), the original TBC is in a state of free stress. Heating makes stress layered in TC and BC, which is attributed to different coefficients of thermal expansion coefficient of two layers. However, they are on the same order of magnitude. From the third contour map to the seventh contour map (from left to right) of Fig. 11(a), it is obvious that the region of high stress generates at the top of TBC, and the zone becomes larger gradually over holding time. TBC generates apparent volume strain due to that CMAS infiltrates the cracks or micro-pores, which leads to an increase in stress. It should be noted that the gradient of stress generated in the zone, which reflects the additive effect of stress. In the beginning, CMAS is a thin layer coated on the TBC. It reacts with TBC in different thicknesses, which leads to volume expansion of the layer. The expansion generates tensile stress within the layer, and it suffers compressive stress from the next layer. The next layer suffers tensile stress from the expansion layer and becomes a new expansion layer over time, so that it generates additive stress compared with the last layer. It is obvious that the most significant stress occurs at the bottom of the corrosion zone. Obviously, the stress in the corrosion zone is in an order of magnitude higher than other zones, which indicates that the corrosion zone is the high-risk area.
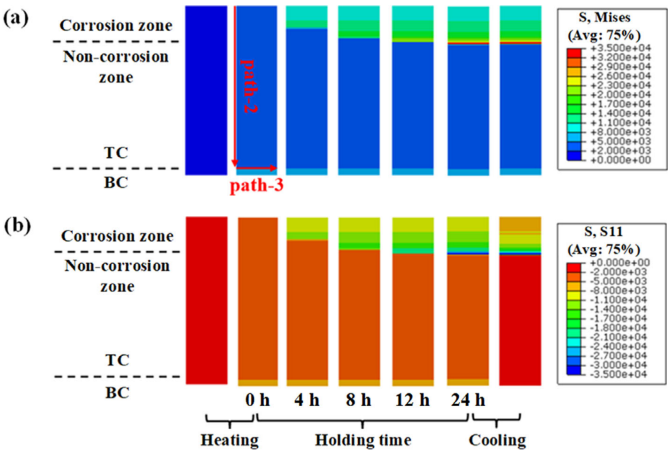
Fig. 11 Two kinds of stress contour plots in different stages: (a) Mises stress and (b) the principal stress along x-direction.
S11 stress represents the principal stress along x-direction. It is obvious that TBC suffers compressive stress under corrosion due to boundary conditions. As an independent columnar structure of TBC, the model must suffer squeezing from other columnar structures, so that the compressive stress is dominated component. The evolution trend of stress is similar to Mises stress, which shows a noticeable stress gradient along the thickness direction of TBC, and the biggest compressive stress occurs at the bottom of the corrosion zone. The generation of the biggest compressive stress is the additive effect of strain, which keeps the same with experimental results. It should be noted that the cooling stage is the crucial stage in traditional thermal experiments. However, there is no obvious distinction of the stress field in the holding stage and cooling stage, which indicates that thermal stress is not a dominated factor compared with other volume strains during CMAS corrosion.
In general, the contour maps indicate that the corrosion zone generates an obviouly higher stress state than other zones, and the interface of TC and BC also exists an evident distinction of stress. The high-stress state of corrosion zone and misfit stress of interface (TC and BC) during CMAS corrosion are possible to cause the failure of TBC. Therefore, path-1 (Fig. 10), path-2 (along the thickness direction in Fig. 11(a)), and path-3 (along the width direction and stay in the interface in Fig. 11) are selected to further study the stress fields of two crucial location, as shown in Fig. 12.

Fig. 12 (a) Stress distribution along path-1 (Fig. 10) and path-2 (Fig. 11(a)) in different corrosion stages, and (b) stress distribution along path-3 (Fig. 11(a)) in different corrosion stages.
As shown in Fig. 12(a), it is obvious that the corrosion zone generates stress mutation, and the stress state in the zone is higher than in other zones. The location of the peak of stress is moving down along thickness direction since CMAS infiltrates deeper over time. The figure in the red dashed box (Fig. 12(a)) exhibits the stress evolution of the corrosion zone more clearly. The evolution of the stress field is studied over time in the whole process. Stress generates in the heating stage due to thermal expansion and decreases along the thickness direction. CMAS corrosion leads to the generation of stress mutation since it increases the volume strain of TBC. It is obvious that the peak of stress occurs in the location of CMAS infiltration, and the location of the peak moves down with the location of CMAS. The location of TBC infiltrated by CMAS stays high-stress state continuously. It will cause the rupture of TBC when the stress is high enough. In the specific holding time, the magnitude of stress in TBC exhibits parabolas in the corrosion zone, which shows that the gradient of stress is linear along the thickness direction. The conclusion provides a forecast for the stress along the thickness direction and failure of TBC. For a specific TBC thickness, the stress is increasing over time only in the heating stage and CMAS corrosion stage. In the cooling stage, the stress evolves from a high-stress state to a low-stress state. This variation will increase residual stress in TBC and decrease the lifetime of TBC.
The distribution and evolution of stress in the interface of TC and BC are illustrated in Fig. 12(b). The heating stage causes the stress state mutation in the interface, which transforms stress from a low-stress state to a high-stress state. It is obvious that CMAS corrosion has little influence on the stress state, which could be explained by the Saint-Venant principle. The transformation of stress in the cooling stage is contrary to that in the heating stage, and the high-low transformation of stress increases the risk of damage of TBC.
The numerical analysis indicates that CMAS corrosion has serious influences on the stress field of TBC but quite limited effect on steady-state temperature field. CMAS infiltration generates a high-stress region of the corrosion zone, and there is a parabolic relationship between the stress and thickness of TBC in a specific holding time. The correlation of stress and thickness makes the stress predictable, further increasing the possibility of forecasting TBC’s lifetime during CMAS corrosion. The peak stress is possible to result in the increasing risk of rupture of TBC over holding time. However, CMAS corrosion has a slight influence on the stress state of the interface (TC and BC), which is mainly affected by the thermal stress. In general, the thickness of the infiltration of CMAS generates the most serious damage of TBC, which leads to the stress sharp increase and further increases the risk of damage. All these conclusions could provide effective advice for the protection of TBC in CMAS environment.
6 Conclusions
In this work, the temperature and stress fields of SPS TBC under CMAS corrosion are investigated by combining experiments with numerical simulations. The results provide effective suggestions for decreasing the detriments of TBC in CMAS corrosion. The main conclusions are summarized as follows:
1) The reaction between CMAS and YSZ is divided into three steps, i.e., dissolution, upon saturation, and re-precipitation, which is accompanied by volume expansion of the reaction layer. The reaction layer thickness and bending degree exhibited exponential decay relationship with time.
2) A corrosion model of CMAS is established. The corrosion process is simplified as follows: generation of the reaction layer, expansion of volume in the reaction zone, and increase of the reaction layer thickness. The relationship between the volume expansion rate and time is exponential decay relationship during CMAS corrosion. The numerical results of bending degree of TBC under CMAS attack are in good agreement with experimental results.
3) The numerical results proved that CMAS corrosion has no apparent effect on the steady temperature field, but has a significant impact on the stress field of TBC. There is a nonlinear increasing relationship between the stress and thickness of TBC at the specific holding time. The peak of stress, which increases over holding time during CMAS corrosion, is one of the factors to induce brittle rupture of TBC.
4) It is deduced that the volume strain generates the most severe damage in TBC, which is the main reason leading to stress mutation and concentration during CMAS corrosion. Therefore, restraining the volume strain of TBC or thickness of infiltration will decrease the detriments of CMAS corrosion.
Reference: Omitted
Declaration: This article is provided by CERADIR™ users or obtained from Internet, the content does not represent the position of CERADIR™. We are not responsible for the authenticity/accuracy of the article, especially the effects of the products concerned. This article is for study only, it does not constitute any investment or application advice. For reprinting, please contact the original author. If it involves the copyright and/or other issues, please contact us and we will deal with it asap! CERADIR™ has the interpretation of this declaration.