Abstract: In this work, pitch-based carbon fibers were utilized to reinforce silicon carbide (SiC) composites via reaction melting infiltration (RMI) method by controlling the reaction temperature and resin carbon content. Thermal conductivities and bending strengths of composites obtained under different preparation conditions were characterized by various analytical methods. Results showed the formation of SiC whiskers (SiCw) during RMI process according to vapor—solid (VS) mechanism. SiCw played an important role in toughening the Cpf/SiC composites due to crack bridging, crack deflection, and SiCw pull-out. Increase in reaction temperature during RMI process led to an initial increase in thermal conductivity along in-plane and thickness directions of composites, followed by a decline. At reaction temperature of 1600 °C, thermal conductivities along the in-plane and thickness directions were estimated to be 203.00 and 39.59 W/(m·K), respectively. Under these conditions, bending strength was recorded as 186.15±3.95 MPa. Increase in resin carbon content before RMI process led to the generation of more SiC matrix. Thermal conductivities along in-plane and thickness directions remained stable with desirable values of 175.79 and 38.86 W/(m·K), respectively. By comparison, optimal bending strength improved to 244.62±3.07 MPa. In sum, these findings look promising for future application of pitch-based carbon fibers for reinforcement of SiC ceramic composites.
Keywords: pitch-based carbon fiber; continuous carbon fiber reinforced silicon carbide matrix composites (C/SiC); thermal conductivity; bending strength
1 Introduction
Continuous carbon fiber reinforced silicon carbide matrix composites (C/SiC) are promising thermal structural materials with low density, high specific strength, superior specific modulus, elevated temperature resistance, good wear resistance, and relevant chemical resistance [1–3], which make them useful for applications in aerospacerelated fields. As a result, comprehensive research investigations have been focused on the preparation technologies, such as chemical vapor infiltration (CVI), reaction melting infiltration (RMI), and polymer infiltration pyrolysis (PIP), as well as the mechanical properties of obtained C/SiC composites to satisfy the increasingly stringent demands for new types of aerospace vehicles and advanced engines [4,5].
However, the poor heat conduction of C/SiC composites along the in-plane and thickness directions has limited their wider applications. In recent years, numerous research investigations have been devoted to improving the thermal conductivity of C/SiC composites [6–11]. One of the most widely used approaches is the incorporation of materials with high thermal conductivity into ceramic materials. For instance, Chen et al. [9] utilized PIP method to produce C/SiC composites with vertically aligned carbon nanotubes (CNTs) on carbon fiber preform. The thermal conductivity in through-thickness direction of the resulting materials reached 16.8 W/(mK). Yang et al. [10] successfully improved the thermal conductivity of C/SiCN composites to 5.6 W/(m·K) by embedding CNTs into inter-bundle spaces of two adjacent carbon fiber sheets by the vacuum infiltration method. Feng et al. [11] introduced bucky-papers (CNT film) into SiC fiber preform to prepare SiCf–CNTs/SiC composites with layered matrix structures. The thermal conductivity of the as-obtained material was found to be 23.9 W/(m·K), which was 2.9-fold higher than that of the traditional SiC/SiC composites. Besides, we previously developed a novel approach based on the introduction of heat transfer channels into C/SiC composites to yield better thermal conductivities [8,12]. Cao et al. [8] employed laser assisted-chemical vapor infiltration (LA-CVI) method to fabricate CNT/SiC micro-pillars in C/SiC composites as heat transfer channels to yield improved thermal conductivity of 20.69 W/(m·K). Zhang et al.[12] inserted pitch-based carbon fiber along the thickness direction of C/SiC composites to construct heat conductive micro-pipelines with the highest thermal conductivity of 32.70 W/(m·K). However, the above studies are based on the use of CNTs or other materials to modify the composites or construction of heat conduction channels inside the composites, which still lack control and stability due to the uncontrollable behaviors of CNTs or other nanomaterials at the nanoscale, as well as the difficulties encountered with various preparation techniques [8,12].
Polyacrylonitrile (PAN)-based carbon fibers, such as T300 and T700, are preferred fiber reinforcement materials used in C/SiC composites for aerospace applications due to their excellent mechanical properties [13,14]. However, the thermal conductivity of PAN-based carbon fibers along the radial direction is only about 4.9 W/(m·K) [15], resulting in limited improvement of thermal conductivity of C/SiC composites. Pitch-based carbon fibers derived from mesophase pitch have superior modulus and high thermal conductivity that may reach hundreds of folds that of PAN carbon fibers. Hence, pitch-based carbon fibers have great potential in aerospace, medical treatment, construction, sports equipment, and many other application fields [16–18]. Recently, pitch-based carbon fibers have mainly been used in carbon matrix composites, while few research studies have been reported on the use of pitch-based carbon fibers to reinforce ceramic matrix composites. For example, Odeshi et al. [16] compared C/C–SiC composites reinforced by PAN-based carbon fiber and pitch-based carbon fiber. They found that C/C–SiC composites prepared by pitch-based carbon fiber possessed higher flexural strength (152 MPa) than PAN-based carbon fiber (133 MPa), which can be attributed to the longer load transfer length of the pitch-based fiber compared to PAN-based fiber. Servadei et al. [19] fabricated Cf/ZrB2–SiC composites reinforced by ultra-high modulus pitch-based carbon fiber via PIP process. The bending strengths of carbon preform constituted by 0°, 0°/90°, and 2D were found to be 500, 370, and 190 MPa, respectively. Mainzer et al. [20] used pitch-based fibers to produce C/SiCN composites via PIP method with a tensile strength of 288 MPa. Therefore, pitch-based carbon fiber reinforced ceramic matrix composites are promising but their potential in the engineering field is still untapped.
The RMI process is effective for the rapid fabrication of ceramic matrix composites with high density [21]. The phase composition and microstructure caused by factors such as reaction rate, melt viscosity, behavior of silicon during phase transition, and wetting of reinforcement, are critical for successful composites. Li et al. [22] studied the effects of different diamond concentrations on thermal conductivities of diamond–C/SiC produced by RMI method. They found that higher diamond concentrations led to improved density (2.18 g/cm³), bending strength (309.01 MPa), and thermophysical properties (thermal conductivity: 14.68 W/(m·K), thermal expansion coefficient: 2.69×10⁻⁶ K-1) of the resulting composites. Zhong et al. [23] fabricated novel hierarchically porous carbon structures in fiber preform with a median pore size of 1.8 μm. The as-formed C/SiC composites exhibited tensile strength of 159±5 MPa, a value of 46% higher than that of normal C/SiC composites.
In this work, pitch-based carbon fiber reinforced SiC composites were obtained by CVI combined with RMI process. The effects of reaction temperature and resin carbon content during RMI process on the microstructures and phase compositions of the composites were investigated. The bending strengths and thermal conductivities of Cpf/SiC composites were thoroughly studied. SiCw samples were also constructed, and both growth and action mechanisms were investigated. The results indicated that Cpf/SiC composites possessed good bending strength and excellent thermal conductivity.
2 Experimental
2. 1 Materials
Mesophase pitch-based carbon fibers TC-HC-500 (Shaanxi Tiance New Materials Technology Co., Ltd., China) were used as reinforcement for C/SiC composites. Phenolic resin (Henan Hengtong Chemical Co., Ltd., China) was utilized as a carbon source for the reaction with molten Si (thermosetting resin).
2. 2 Preparation of Cpf/SiC composites
Pitch-based carbon fiber was abbreviated as PB-fiber. Basic property of T300 and PB-fibers are listed in Table 1. SiC composites reinforced by pitch-based carbon fibers in this work were named as Cpf/SiC. As depicted in Fig. 1, the PB-fibers were woven into unidirectional fiber sheets and stacked by needle-punching along the 0°/90° direction to fabricate fiber preform. The fiber volume content of the composites was 43%.

Fig. 1 Schematic diagram showing the pitch-based carbon fiber sheet, fiber preform, and composites.
Table 1 Properties of T300 and PB-fibers [15]

The combined CVI–RMI process mainly consisted of two steps. The first step was the preparation of porous Cpf/SiC composites by CVI. To this end, PyC interphase (150 nm in thickness) was deposited on the preform, and then treated at 1800 ℃ for 2 h under vacuum to eliminate residual thermal stress. Thereafter, SiC matrix was infiltrated into the porous preform via CVI for 280 h at 1100 ℃. During the CVI process, methyltrichlorosilane (MTS, CH3SiCl3) was used as a precursor, and the process was carried out by bubbling hydrogen. Argon was employed as the diluent gas to slow down the reaction rate, and the pressure of the whole system was controlled at 5 kPa. After 3–4 CVI cycles in the furnace, the density of Cpf/SiC composites reached 1.6 g/cm³.
The second step consisted of the densification process by RMI. To this end, phenolic resin powder and absolute ethanol were mixed at the mass ratio of 1:3 to obtain a phenolic resin solution. After infiltration by resin solution in vacuum pot for 30 min, Cpf/SiC composites with resin were pyrolyzed under argon (purity ≥ 99.999%) at 950 ℃ for 2 h to transform the polymer carbon into amorphous carbon, representing the end of one cycle of impregnation. After pyrolysis, the change in mass of the samples was recorded, and samples were embedded with superfluous Si powders followed by wrapping with graphite papers. Next, the samples were placed in a Si-infiltration furnace for 30 min under vacuum to yield Cpf/SiC composites.
Siliconization samples prepared at 1500, 1600, 1700, and 1800 ℃ were denoted as T15#, T16#, T17#, and T18#, respectively. Porous samples were infiltrated with resin and pyrolyzed for 2, 4, 6, and 8 times to yield composites 2C#, 4C#, 6C#, and 8C#, respectively.
2. 3 Characterization
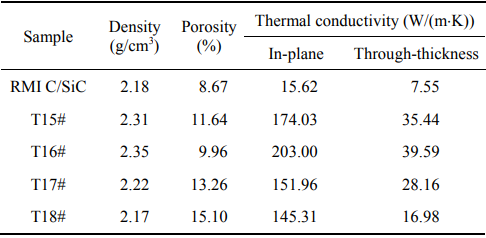
The density and open porosity of the composites were measured by the Archimedes method, and the results are gathered in Table 2. The crystal phases of the samples were identified by X-ray diffraction (XRD; Rigaku D/max-2400, Japan). Raman spectrum was conducted by a Raman spectroscopy (confocal Raman microscope, Renishaw, Beijing, China). Three-point bending tests were carried out by an electro-mechanical universal testing system (Instron 5567, UK) at room temperature and a loading rate of 0.5 mm/min. To this end, the prepared composites were processed into 40 mm × 5 mm × 3 mm specimens for use in each test. The microstructures of the composites were characterized by the scanning electron microscope (SEM; FEI, Helios G4 CX, USA) equipped with the energy dispersive spectrometer (EDS) and the back-scattered electron (BSE) detector. The thermodynamic properties were calculated by the FactSage software (Thermfact/CRCT, Canada and GTT-Technologies, Germany). The thermal diffusivity (α) and heat capacity (Cp) of each sample were measured by the laser flash method (LFA 427, NETZSCH, Germany) at a heating rate of 2 ℃/min. The thermal conductivity (λ) of each composite was calculated according to the equation: λ = α × Cp × ρ, where ρ is the specimen density and Cp is the specific heat capacity. The sample sizes in through-thickness and in-plane directions were Φ 12.7 mm × 3 mm and 10 mm × 5 mm × 3 mm, respectively.
Table 2 Properties of Cpf/SiC composites at different siliconization temperatures
3 Results and discussion
3. 1 Microstructures and morphologies of pitch-based carbon fibers
The crystal structures of the two types of carbon fibers were analyzed by XRD, and the results are shown in Fig. 2(a). The interplanar spacing (d002) and half-peak width of (002) peak can reveal the graphitization degree of carbon fibers [24]. Smaller d002 values and narrower (002) peak indicated more integrated crystallinity and higher degree of graphitization [25]. Additionally, the half-peak width of (002) peak in the equatorial scanning patterns of the fibers (Fig. 2) was used to calculate the graphite microcrystalline stacking thickness (LC). Smaller half-peak widths demonstrated larger stack thicknesses and more stacked graphite layers. The d002 values were obtained by the Bragg equation (Eq. (1)) [26], where λ is the wavelength of the X-ray (Cu Kα1, 1.54060 nm) and θ represents the half-peak width (in radian). The LC values were calculated by the Scherrer formula (Eq. (2)) [27], where K is the Scherrer factor (also known as the shape factor or K = 0.92), and β is the full width at half maximum of the diffraction peak. The XRD structural parameters of the two types of fibers are listed in Table 3.
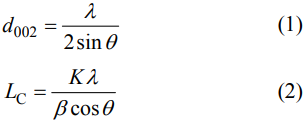
Table 3 XRD structural parameters of T300 and PB-fibers
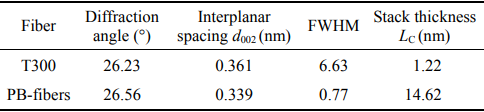
As depicted in Fig. 2(a) and Table 3, the two types of carbon fibers showed a radiating peak at about 2θ = 25° with significantly different features. Compared to T300, PB-fibers displayed a strong and sharp (002) peak, as well as smaller interplanar spacing and thicker stacked sizes. These features indicated larger microcrystal dimension, higher degree of graphitization, and more complete stacking of graphite microcrystals.
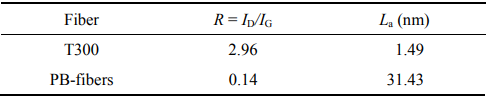
The as-obtained composites were further analyzed by the Raman spectroscopy [25,28]. As shown in Fig. 2(b), the two types of carbon fibers exhibited typical Raman bands identified as D peak and G peak. The intensity of G peak was used to characterize the integrity of sp² hybridized structure in graphite, while D peak was employed to study the degree of orientation and structural defects in graphite. The 2D peak (2700 cm-1) in Raman spectrum was also utilized to identify the monolayer and multilayer of graphene [29], which verified the layered graphite structure of PB-fibers. The intensity ratio (R) of D to G peak was used to estimate the degree of graphitization, where a lower R-value represents a higher degree of graphitization. In Fig. 2(b), the larger strength of D peak in T300 yielded broad and overlapped D peak and G peak, suggesting incomplete graphite structures and disordered lamellars of T300. Tuinstra and Koenig [30] observed a linear relationship between R and reciprocal value of grain size in crystal plane (La) according to the empirical formula shown by Eq. (3). The Raman structural parameters of the two fibers are compiled in Table 4.


Fig. 2 XRD patterns and Raman spectra of T300 and PB-fibers.
Table 4 Raman structural parameters of T300 and PB-fibers
The cross-sectional SEM images of the two types of fibers are presented in Fig. 3. Both fibers displayed significant differences in the order of graphite structures. The structures of carbon fibers were made of disorderly lamellar graphite structures. Bennet et al. [31] proposed a skin–core model to describe the microstructure of carbon fibers. They found high modulus carbon fiber to possess layers of graphite microcrystals arranged orderly along the fiber axis in the cortex. The cores showed a slightly disordered shape of folds with intricate pore structures between the layers of graphite. The skin–core model could accurately describe the microstructures of PB-fibers. Compared to PB-fibers, the graphite microcrystals of T300 were tightly stacked but in a disordered manner. These data were consistent with the XRD and Raman analyses.
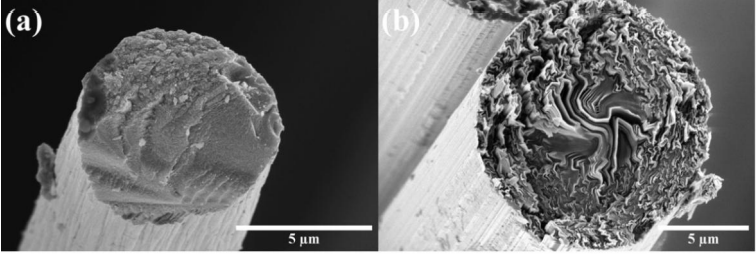
Fig. 3 Microstructures of cross-sections: (a) T300 and (b) PB-fibers.
3. 2 Growth mechanism of SiC whiskers
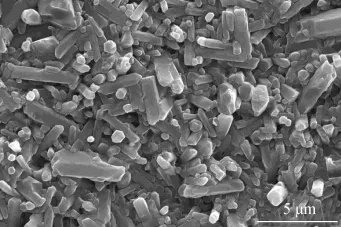
As shown in Fig. 4, large amounts of SiC whiskers (SiCw, diameter: ~0.8 μm) were formed during RMI process. Note that SiCw was characterized by a single crystal with a high orientation (diameter from nanometer to micrometer). Besides, SiCw possessed few chemical impurities, no grain boundaries, few crystal defects, and uniform crystalline phase composition. These features provided SiCw with good specific strength, high specific elastic modulus, and high thermal conductivity. In the following sections, Cpf/SiC composites are produced at different siliconization temperatures; therefore, the different growth mechanisms of SiCw at various siliconization temperatures should be discussed first.
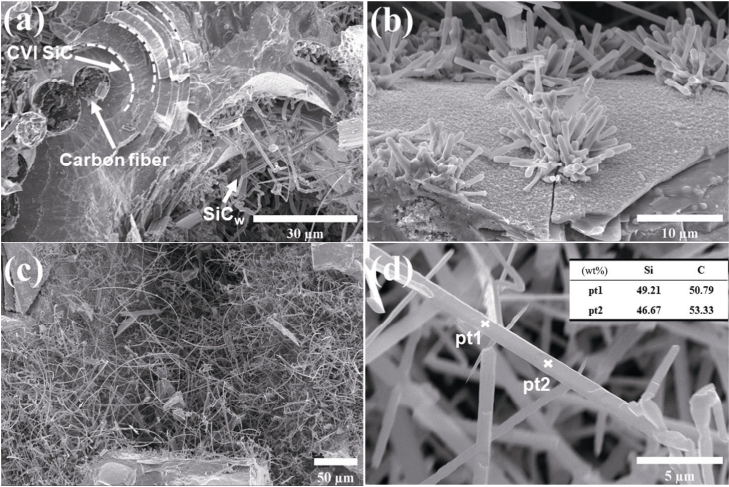
Fig. 4 Microstructures and EDS analyses of SiCw.
According to the studies [32–34], SiCw can be synthesized without the assistance of a catalyst. In other words, C and Si can directly react to form SiCw. Wei et al. [34] studied the growth mechanism of SiC nanowires prepared by ball-milled activated carbon and vaporized silicon at 1600 ℃ without a catalyst. Their results identified vapor–solid (VS) interaction as the dominant mechanism. Li et al. [33] synthesized SiCw using reactive graphite as a template and found that graphite with a higher density of defects could accelerate the formation of SiCw. The studies of Dai et al. [32] and Chen et al. [35] indicated that the formation of SiCw was achieved by three main stages, which included the generation of intermediate products, the formation of SiC nuclei, and the growth of SiCw. The related reactions (several intermediate reactions included) are shown as Reactions (4)–(10). To further understand the growth mechanism of SiC whiskers in this work, the Gibbs free energy of the reaction at various temperatures (1500–1800 ℃) was calculated by FactSage software. The reaction can happen spontaneously when the Gibbs free energy is less than 0. The standard Gibbs free energy of each reaction is shown in Fig. 5.
C(g) + SiO2(s) = SiO(g) + CO(g) (4)
CO(g) + SiO2(s) = SiO(g) + CO2(g) (5)
Si(g) + SiO2(s) = 2SiO(g) (6)
SiO(g) + 2C(s) = SiC(s) + CO(g) (7)
Si(g) + C(s) = SiC(s) (8)
3SiO(g) + CO(g) = SiC(s) + 2SiO2(g) (9)
SiO(g) + 3CO(g) = SiC(s) + 2CO2(g) (10)
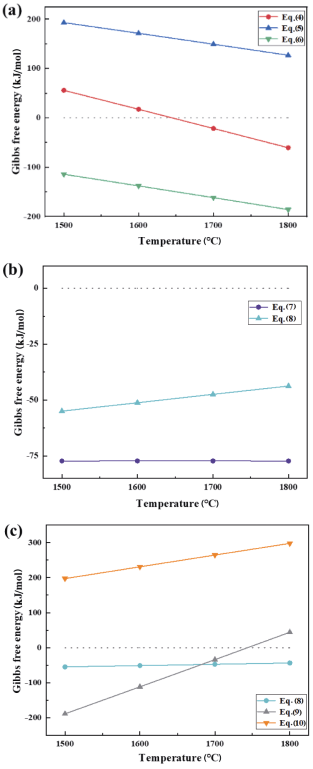
Fig. 5 Gibbs free energy change of Reactions (4)–(10) calculated by FactSage software: (a) formation of intermediate products, (b) formation of SiC nuclei, and (c) growth of SiCw.
First, the intermediate products SiO and CO were produced via Reactions (4)–(6). As depicted in Fig. 5(a), Reaction (5) had positive Gibbs free energy at 1500–1800 ℃, and Reaction (6) had negative Gibbs free energy, which demonstrated that generation of SiO and CO was mainly due to Reactions (4) and (6) (greater than around 1650 ℃). Second, the Gibbs free energy in Fig. 5(b) had negative value, which illustrated that the formation of SiC nuclei could happen completely spontaneously and mainly contributed by Reaction (7) (lower Gibbs free energy). Finally, as shown in Fig. 5(c), the growth of SiCw was basically dominated by Reactions (8) and (9). When the temperature exceeded around 1740 ℃, Reaction (8) was the only reaction for SiCw growth.
Based on the above analysis, the growth mechanism of SiCw in the present work can be concluded as follows: VS mechanism governed the whole process. At 1500 and 1600 ℃, the dominant reactions were Reactions (6)–(9). At 1700 ℃, the dominant reactions were Reactions (4) and (6)–(9). At 1800 ℃, the dominant reactions were Reactions (4) and (6)–(8). Si, carbon, and porous Cpf/SiC composites provided a good environment for SiCw growth. In Fig. 4(a), SiCw grew on the outside of the layered CVI SiC matrix, suggesting that SiCw was formed during RMI instead of CVI process. The O-element involved in the reaction processes originated from SiO2 in commercial Si powder. The schematic diagram of the growth of SiCw is depicted in Fig. 6. First, SiO and CO were generated by Reactions (4)–(6). Then, the superfluous Si vapor and SiO vapor were adsorbed on the residual carbon (activated carbon atoms) surface during RMI process and reacted to form SiC nucleus. Later, SiCw grew along (111) direction [32,34,35] of SiC nucleus to form long and randomly oriented SiCw following Reactions (8) and (9), according to the literature.
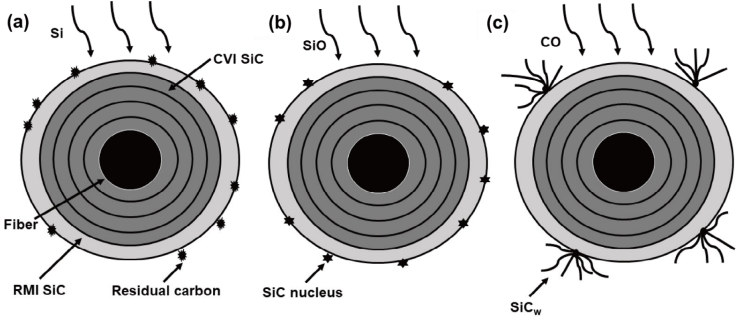
Fig. 6 Schematic diagram showing the formation of SiCw.
3. 3 Thermal conductivity of Cpf/SiC composites
3.3.1 Effects of different siliconization temperatures
The melt infiltration process can use almost any reinforced geometry to yield high-density and low-porosity matrices. Different reaction temperatures (beyond the melting point of silicon, 1415 ℃) of RMI can lead to various phase compositions and microstructures, thereby affecting the properties of Cpf/SiC composites. Table 2 summarizes the properties of Cpf/SiC composites prepared at different siliconization temperatures. The thermal conductivities in this work were measured at 35 ℃. Note that the densities were repeatedly measured, and the obtained thermal conductivities were averaged to yield the values shown in Table 2. The data of traditional RMI C/SiC were collected from our database and were compared with the composites in this work. Apparently, composites in this work possessed excellent thermal conductivity. As can be seen, the densities of composites increased first with the reaction temperature and then decreased, and maximum density was recorded at 1600 ℃. As shown in Fig. 7, the microstructures of the composites were consistent with the changing trend of density. The reaction between Si and C was theoretically more efficient at high temperatures. However, the exothermic reaction between Si and C resulted in excess local temperature and vaporization of large amounts of Si [36,37]. At reaction temperatures of 1500 and 1600 ℃ (Fig. 8), the reactants Si and C displayed weaker peaks, while the product SiC illustrated stronger peaks. At temperatures of 1600 and 1700 ℃, the C peaks became extremely strong but the Si peaks weakened or even vanished. Hence, large amounts of Si vaporized while the graphitized resin carbon remained in the composites. The incomplete reaction between Si and C resulted in porous microstructures of T17# and T18#, while larger-sized pores remained. On the other hand, the reaction rate of Si and C was too fast and was much higher than the flow rate of liquid Si at high temperature, which blocked the permeability channels for molten Si.
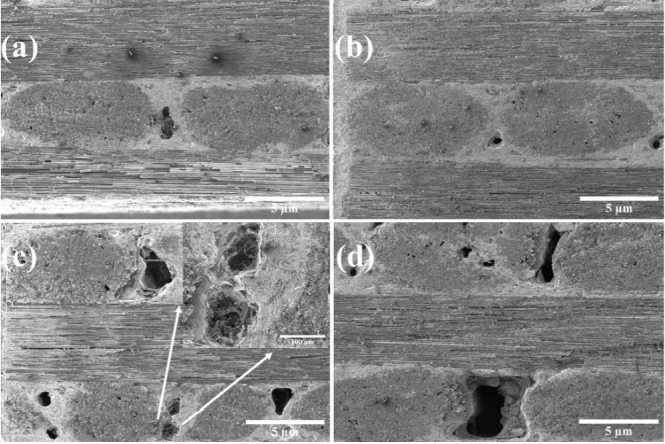
Fig. 7 Microstructures of Cpf/SiC composites prepared at different siliconization temperatures: (a) 1500 ℃, (b) 1600 ℃, (c) 1700 ℃, and (d) 1800 ℃.
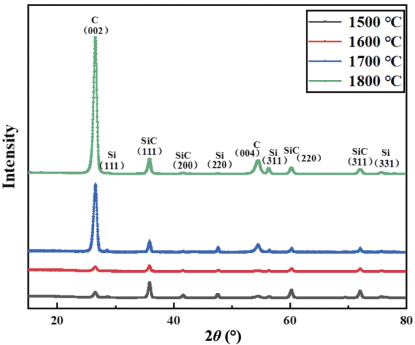
Fig. 8 XRD patterns of Cpf/SiC composites prepared at different siliconization temperatures.
The thermal conductivity of the as-prepared composites showed the same trend as the density, suggesting the crucial impact of densification on heat transfer properties. Compared to C/SiC composite prepared by T300, the Cpf/SiC composites possessed much better thermal conductivities in both the thickness and in-plane directions. In particular, the thermal conductivity in the in-plane direction was more than a dozen-fold higher than that of RMI C/SiC. As mentioned in Section 3.1, graphite crystallites with high orientation along the fiber axis direction greatly reduced the scattering of phonons, thereby improving the transfer efficiency. Compared to the preform prepared by plain weave in axial and radial directions, the preform fabricated by unidirectional fibers possessed more fibers per unit volume along specific directions. The heat transfer modes along different directions are presented in Fig. 9. Obviously, the heat flow was faster along the fiber direction with less loss. Along the thickness direction, the heat transfer efficiency greatly reduced due to the elevated interfacial thermal resistance (top right corner of Fig. 9).
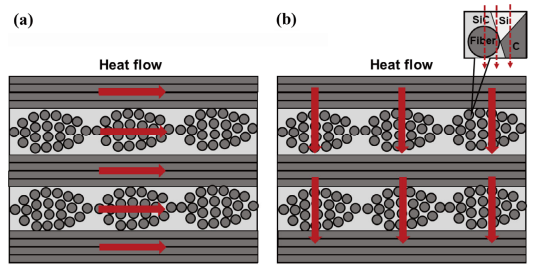
Fig. 9 Schematic diagram of heat transfer in different directions of the composites.
In this work, because of the evaporation of large amounts of Si under high temperature, SiCw tended to grow at lower reaction temperatures (1500, 1600, and 1700 ℃). As a result, SiCw did not only improve the densification of the composites but also filled some pores (Fig. 7(c)).
3.3.2 Effect of different contents of resin carbon
All samples were fabricated by the same RMI process at 1600 ℃ but at various resin carbon contents. The densities and thermal conductivities of composites obtained at different resin carbon contents are displayed in Table 5. In Section 3.3.1, 1600 ℃ was identified as the appropriate preparation temperature of Cpf/SiC composites. As a result, the increase in resin carbon content did not significantly affect the density and porosity, as seen from the microstructures of the composites. In Fig. 10, no obvious pores were observed, and the microstructures were relatively dense. Compared to thermal conductivities along the thickness direction (Table 5), the variation trend of the thermal conductivity along the in-plane direction was not obvious. Hence, the thermal conductivities along the in-plane direction were not significantly affected by the change in composite structures. Various resin carbon contents induced different phase compositions, thereby significantly affecting the thermal conductivities along the thickness direction of the composites. The phase constitution of the composites was analyzed by the XRD patterns (shown in Fig. 11), where the composites showed stronger SiC peaks compared to Fig. 8. Note that the amorphous type of resin carbon is more difficult to detect by XRD. However, the resin carbon remaining in the matrix would be graphitized at high temperature (1600 ℃) [38]. Consequently, the C peak in XRD became sharper and stronger. Additionally, BSE images of samples 4C#, 6C#, and 8C# in Fig. 12 revealed the local content and distribution of carbon. In the magnified image of Fig. 12(c), massive and agglomerated carbon particles were surrounded by SiC matrix and some Si, generating many grain boundaries.

Fig. 10 Microstructures of Cpf/SiC composites obtained with different resin carbon contents: (a) 2C#, (b) 4C#, (c) 6C#, and (d) 8C#.
Table 5 Properties of Cpf/SiC composites prepared with different resin carbon contents
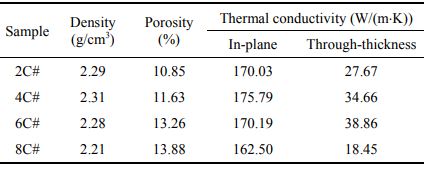
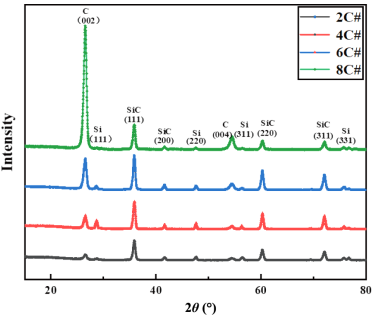
Fig. 11 XRD patterns of Cpf/SiC composites prepared with different resin carbon contents.
As shown in Table 5, the thermal conductivities increased with carbon content and maximum value reached 38.86 W/(mK). This could be attributed to the compact microstructure and high thermal conductivity of graphitized resin carbon. However, the thermal conductivity of 8C# reduced to 18.45 W/(mK) due to the interface thermal resistance generated by excess graphitized resin carbon and other phases (SiC and Si). On the other hand, the thermal conductivities along the in-plane direction were mainly generated by the pitch-based fibers, which were less impacted by the composite structures (Section 3.3.1). As a result, the thermal conductivities remained relatively stable.
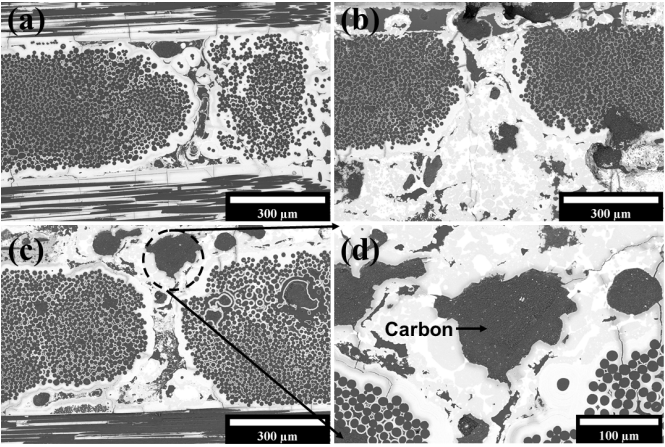
Fig. 12 BSE images of Cpf/SiC composites prepared with different resin carbon contents: (a) 4C#, (b) 6C#, and (c) 8C#.
3. 4 Bending strengths of Cpf/SiC composites
3.4.1 Effect of different siliconization temperatures
The bending strengths and bending moduli of Cpf/SiC composites obtained at different reaction temperatures are listed in Table 6. The bending strength of the composites at various siliconization temperatures was about 170 MPa, and composites with higher densities possessed better bending strengths. Compared to the bending strengths of traditional C/SiC composites prepared by CVI process, Cpf/SiC composites showed lower but acceptable values. This could first be attributed to pitch-based carbon fibers. Microcrystalline graphite highly orientated along the fiber axis could provide elevated heat transfer properties but poor bending and compressive strengths since the graphite sheets were spaced far apart (Fig. 3). Second, the unidirectional fibers preform significantly affected the transverse bending strengths of the composites. For transverse strength of 0°/0° composites, the fibers could not effectively bear the load transferred from the matrix in this direction [39]. Finally, the reactive melt of RMI process might damage the fibers, and the presence of residual Si and C would also reduce the mechanical properties of the composite due to cracks generated at the interface between the residual phase and matrix [22].
Table 6 Bending strengths of Cpf/SiC composites prepared at different siliconization temperatures

Photographs and microstructures of the fractured surfaces of samples T15# and T18# are depicted in Fig. 13. The fractured areas of the composites were large with layered failure mode, indicating the formation of composites with good toughness. The microstructures of the fractured samples showed that long fiber bundles were pulled out (Fig. 13). A pull-out effect [40] of the fibers can also be observed in Fig. 14(a). As mentioned above, pitch-based carbon fibers had distinct and highly orientated layered structures (Figs. 14(a) and 14(b)). Large amounts of fiber fragments were observed in Fig. 14(a), especially at high magnifications where the fractured surface of the fiber was not only flat but similar to a layered structure. Hence, the graphite layers of the fibers were pulled out from the inside through layer by layer mode under tensile and shear loads. This type of internal layered pull-out phenomenon is typical for pitch carbon fibers.

Fig. 13 Photographs and microstructures of the fractured surfaces of samples T15# and T18#.
On the other hand, SiCw played an important role in strengthening and toughening of composites, especially in terms of toughening [41,42]. Here, the main toughening mechanisms of SiCw were based on crack deflection,crack bridging, and whisker pull-out. First, the crack propagating in the matrix was deflected upon contact with SiCw due to the mismatch in the elastic modulus between SiCw and SiC matrix [43]. In turn, crack deflection could change the propagation path of the crack or make the crack branched, thereby absorbing the fracture energy and resulting in cracks no longer perpendicular to the stress. Hence, the crack can further be expanded by only increasing the strength of the stress at the crack tip. In turn, this process released stress concentration at the crack tip, inhibiting the crack propagation in the composites [43]. Second, crack bridging occurred behind the crack front where the bridging ligaments were connected to the crack faces. By adding extra pressure during the crack opening, SiCw decreased the stress intensity near the crack tip, thereby toughening the composites [44]. As shown in Figs. 14(c) and 14(d), large amounts of SiCw were distributed on both sides of the crack. Lastly, plenty of pulled-out SiCw covered by SiC matrix and holes left after pull-out were clearly observed in Figs. 14(e)–14(g). Due to the high tensile strength of whiskers, they are difficult to break. When the load was transferred from the matrix to the whiskers, and the shear stress generated on the interface between them reached the shear strength of the interface, the whiskers pulled out from the matrix [45]. Extra energy would be consumed when whiskers are pulled out.
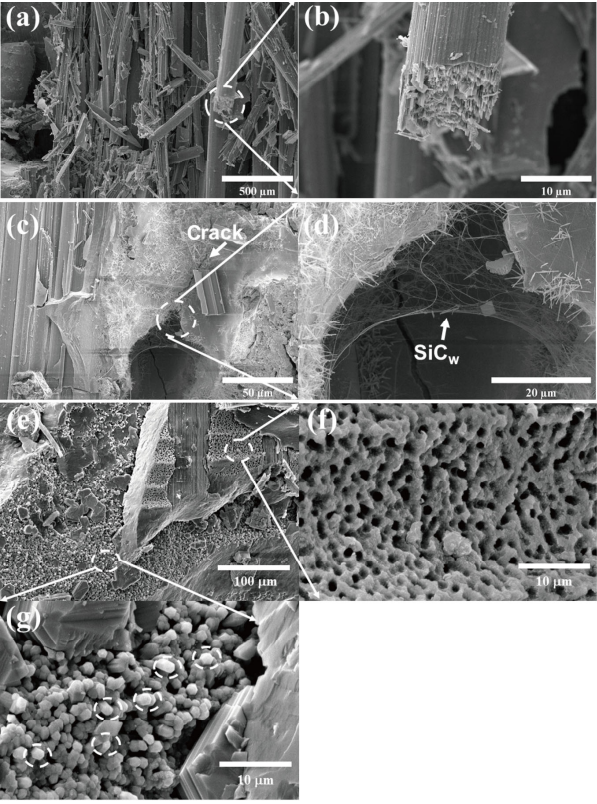
Fig. 14 Microstructures of fractured fibers and SiCw.
3.4.2 Effect of different contents of resin carbon
The bending strengths and moduli of Cpf/SiC composites prepared with different resin carbon contents are listed in Table 7. The average bending strength improved by 25% compared to the values listed in Table 6, and the optimal value reached 244.62±3.07 MPa. During RMI process, residual Si remaining in the SiC matrix reduced the mechanical properties due to the unequal stress generated by different coefficients of thermal expansion. Hence, sufficient carbon sources were beneficial to the RMI process with less residual Si.
Table 7 Bending strengths of Cpf/SiC composites prepared with different resin carbon contents

Photographs and microstructures of Cpf/SiC composites prepared with different resin carbon contents are presented in Fig. 15. The holes are left after fiber pull-out and abundant SiCw can be clearly observed in Figs. 15(a) and 15(b), respectively. This indicated the ductile fracture of the composites. Note that the same fracture behavior and the toughening mechanism by SiCw were discussed in Section 3.4.1.
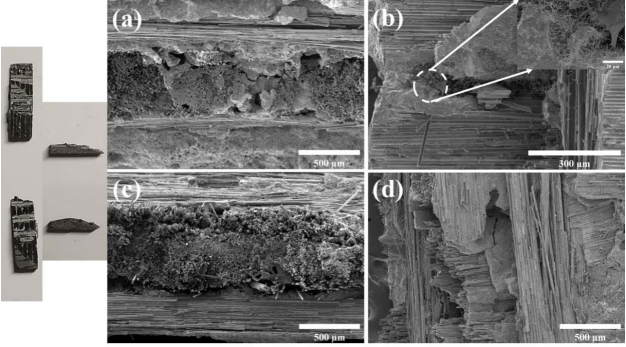
Fig. 15 Photographs and microstructures of fractured surfaces of samples 4C# and 8C#.
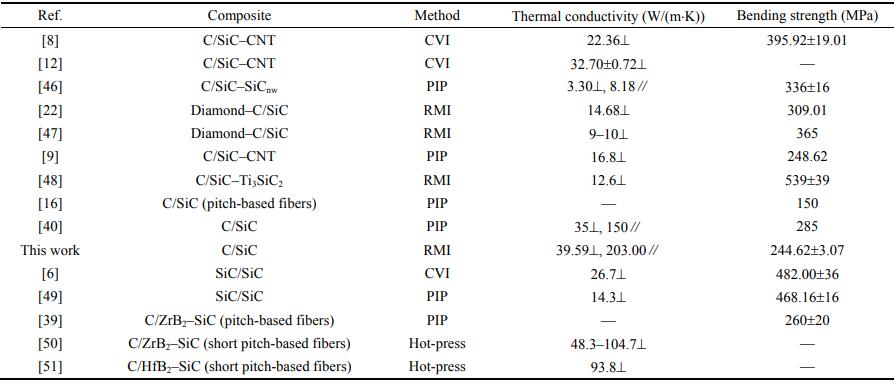
The thermal conductivities and bending strengths of recently reported fiber-reinforced ceramic matrix composites in comparison with materials prepared in this study are summarized in Table 8. Composites prepared herein showed excellent heat transfer performance and favorable bending strengths. At present, there is limited research on pitch-based fiber reinforced ceramic matrix composites, but this comparison shows great potential of these materials, which deserve to be studied further.
Table 8 Thermal conductivities and bending strengths of recently reported fiber-reinforced ceramic matrix composites in comparison with the materials prepared in this study
4 Conclusions
Cpf/SiC composites were successfully fabricated by RMI method by controlling the reaction temperature and resin carbon content. The thermal conductivities and bending strengths of the as-obtained composites under different preparation conditions were studied and results were discussed. The following conclusions can be drawn:
SiC whiskers were formed during RMI process through a VS mechanism. Growth mechanism at different siliconization temperatures was investigated by the Gibbs free energy of the reactions. The presence of SiCw played an important role in toughening of Cpf/SiC composites.
The increase in reaction temperature of RMI process first led to a rising trend of the thermal conductivity along the in-plane and thickness directions, followed by a decline. At 1600 ℃, the thermal conductivities along the in-plane and thickness directions were recorded as 203.00 and 39.59 W/(m·K), respectively. The bending strength was 186.15±3.95 MPa.
The increase in resin carbon content before RMI process led to the formation of more SiC matrix. The thermal conductivities along the in-plane and thickness directions remained stable at 175.79 and 38.86 W/(m·K), respectively. Also, the optimal bending strength improved to 244.62±3.07 MPa.
Reference: Omitted
Declaration: This article is provided by CERADIR™ users or obtained from Internet, the content does not represent the position of CERADIR™. We are not responsible for the authenticity/accuracy of the article, especially the effects of the products concerned. This article is for study only, it does not constitute any investment or application advice. For reprinting, please contact the original author. If it involves the copyright and/or other issues, please contact us and we will deal with it asap! CERADIR™ has the interpretation of this declaration.