Abstract: During flight, many silicates (sand, dust, debris, fly ash, etc.) are ingested by an engine. They melt at high operating temperatures on the surface of thermal barrier coatings (TBCs) to form calcium–magnesium–aluminum–silicate (CMAS) amorphous settling. CMAS corrodes TBCs and causes many problems, such as composition segregation, degradation, cracking, and disbanding. As a new generation of TBC candidate materials, rare-earth zirconates (such as Sm2Zr2O7) have good CMAS resistance properties. The reaction products of Sm2Zr2O7 and CMAS and their subsequent changes were studied by the reaction of Sm2Zr2O7 and excess CMAS at 1350 ℃. After 1 h of reaction, Sm2Zr2O7 powders were not completely corroded. The reaction products were Sm–apatite and c-ZrO2 solid solution. After 4 h of reaction, all Sm2Zr2O7 powders were completely corroded. After 24 h of reaction, Sm–apatite disappeared, and the c-ZrO2 solid solution remained.
Keywords: Sm2Zr2O7 ceramic; calcium–magnesium–aluminum–silicate (CMAS); reaction product; corrosion
1 Introduction
Thermal barrier coatings (TBCs) are used to limit the heat transfer through coatings and protect vital engine components from hot corrosion [1,2]. However, high operating temperatures result in the melting of any silicate (sand, dust, runway, debris, fly ash, volcanic ash, etc.) that may be ingested by an engine [3,4]. These molten silicates, commonly referred to as calcium–magnesium–aluminum–silicate (CMAS), cause severe degradation of TBCs and premature delamination, exposing the metallic components to dangerous hot gases [5–7].
The most commonly used TBC composition is 7 wt% yttria-stabilized zirconia (7YSZ). However, 7YSZ shows poor resistance to CMAS infiltration [8–10]. Therefore, significant research has been performed on searching for new TBC materials with good CMAS resistance. As a new generation of thermal barrier coating candidate materials, rare-earth zirconates (such as Sm2Zr2O7) not only have low thermal conductivity [11–13], appropriate thermal expansion coefficients, and high thermal stability, but also have better CMAS resistance properties than 7YSZ [14,15]. The results studied by Li et al. [14] show that rare-earth zirconates can resist CMAS corrosion in the early stage of the reaction.
Therefore, the reactions of rare-earth zirconates and CMAS have been studied extensively. Most of these studies are devoted to studying the reaction products of rare-earth zirconates and CMAS, such as the study of Gok and Goller [15]. The results studied by Drexler et al. [16] show the reaction products of rare-earth zirconates and CMAS. However, little attention has been given to the element proportion and crystal structure of reaction products. Furthermore, evidence from previous research showed that rare-earth zirconates (such as Sm2Zr2O7) also deteriorated slowly by CMAS with increasing penetration time [16–18]. This phenomenon may be related to subsequent changes in reaction products in excess CMAS. Therefore, the reaction products of CMAS and Sm2Zr2O7 were accurately determined in this paper, and subsequent changes in the reaction products were also studied.
2 Experimental
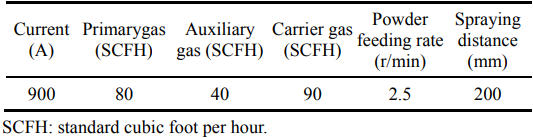
Sm2O3 (99.9%; Forsman, Beijing, China) and ZrOCl2·8H2O (99.5%; Forsman, Beijing, China) were employed as raw materials to produce Sm2Zr2O7 powders by chemical coprecipitation. Sm2O3 powders (80–120 μm) and ZrOCl2·8H2O were dissolved in nitric acid (mass fraction 65%–68%; Sinopharm Chemical Reagent Co., Shanghai, China) and deionized water, respectively [19]. The obtained solution was mixed and stirred to generate a homogeneous solution, followed by cautious addition to ammonia water (mass fraction 25%–28%; Sinopharm Chemical Reagent Co., Shanghai, China) until a gel-like precipitate was obtained. The precipitate was filtered with distilled water repeatedly. After drying at 100 for 24 h and calcina ℃ tion at 1250 for 5 h for crystallization, the resultant ℃ powders were ground and sieved to remove the coarse agglomerates [20]. Then, the Sm2Zr2O7 powders were obtained. The agglomerated Sm2Zr2O7 powders were obtained from Sm2Zr2O7 powder centrifugal spray granulation by centrifugal spray drying machine (LGZ-8, DongSheng, China). And agglomerated Sm2Zr2O7 powders were spheroidized by the plasma spray gun (SG-100, USA) to obtain spherical Sm2Zr2O7 powders. The spheroidization parameters are shown in Table 1. Then, the spherical Sm2Zr2O7 powders were sieved to obtain powders with uniform particle size (60–90 μm).
Table 1 Spheroidization parameters
CMAS with a composition of 38CaO–5MgO–8AlO1.5–49SiO2 in molar ratio was used in this study [21–23]. CaO (≥ 99.7%; Aladdin, Shanghai, China), MgO (≥ 99.7%; Aladdin, Shanghai, China), Al2O3(≥ 99.7%; Aladdin, Shanghai, China), and SiO2(≥ 99.7%; Aladdin, Shanghai, China) were weighed in molar ratios and suspended in alcohol. The mixture was fully mixed by planetary ball milling with absolute alcohol for 72 h at a speed of 350 rpm. The suspension was dried, and the mixed powders were then calcined at 1550 for 4 h and quenched in water [21, ℃ 22]. By repeating the above steps once, CMAS glass for this study was obtained. As presented in Fig. 1, the Sm2Zr2O7 powders were uniformly placed on the top surface of the CMAS glass in a Pt-crucible. And the mass ratio of CMAS and Sm2Zr2O7 powders is 10:1. Then the samples were heat-treated at 1350 for 1, 4, ℃ and 24 h. Above 1200 , CMAS gradually softens and ℃ melts [24]. Sm2Zr2O7 powders enter CMAS under the action of gravity, and are evenly wrapped by CMAS. This method is beneficial to the uniform distribution of Sm2Zr2O7 powders in CMAS.

Fig. 1 Schematic diagram of the experimental method
The phase composition of Sm2Zr2O7 powders after reaction with CMAS was characterized by X-ray diffraction (XRD; X′ Pert PRO MPD, PANalytical, the Netherlands) using Cu Kα radiation. Data were digitally recorded in a continuous scan in the range of angles (2θ) from 10° to 80° with a scanning rate of 4 (°)/min. The microstructure and composition of Sm2Zr2O7 powders after reaction with CMAS were examined by scanning electron microscopy (SEM; Philips S-4800, Hitachi Ltd., Yokohama, Japan) equipped with an energy spectrum analyzer. The reaction product analysis and elemental mapping of Sm2Zr2O7 powders with CMAS after reaction were performed using transmission electron microscopy (TEM; TECNAI G²20, FEI, USA) with an energy dispersive spectrometer (EDS; TECNAI G²20, FEI, USA). The specimen used in TEM was prepared by a focused ion beam instrument (FIB; Crossbeam 540, Carl Zeiss, Germany).
3 Results and discussion
Figure 2 shows the XRD patterns of the powders after reacting with Sm2Zr2O7 and CMAS. Compared with the standard peak PDF card, two kinds of peaks of reaction products can be found in Fig. 2. One is basically the same as the standard peak of Ca2Sm8(SiO4)6O2 (PDF#29-0365). The peaks of Ca2Sm8(SiO4)6O2 offset to high angles because the Ca2Sm8(SiO4)6O2 from the reaction has lattice distortion. The other peak is basically the same as the standard peak of c-ZrO2 (PDF#26-0341). Therefore, there are only Ca2Sm8(SiO4)6O2 and c-ZrO2 in the reaction products. No Sm2Zr2O7 remains in the powders.
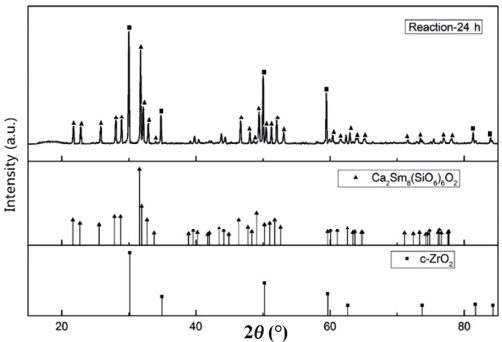
Fig. 2 XRD patterns of the powders after reacting with Sm2Zr2O7 and CMAS.
The images and the EDS patterns of Sm2Zr2O7 powders corroded for 1 h at 1350 are shown in ℃ Fig. 3. As seen in Fig. 3(a), the powders after reacting from Sm2Zr2O7 and CMAS have two morphological characteristics. One is the partly corroded-powder (P1), and the other is the completely corroded-powder (P2). P1 accounts for about 70% of corroded-powders, and P2 accounts for about 30%. Figure 3(b) is an enlarged view of P1. As seen in Fig. 3(b), P1 includes the light center area (Z1) and the dark shell area (Z2). There is a dividing line between Z1 and Z2, as shown by the blue dotted line. According to the EDS pattern, Z2 has Ca, Si, Zr, and Sm elements. Z1 has Zr and Sm but no Ca or Si elements. Ca and Si elements only exist in Z2.

Fig. 3 Images and EDS patterns of Sm2Zr2O7 powders corroded for 1 h at 1350 .
To determine the composition of Z1, TEM was used to analyze the sample. The TEM bright field image of the light center area is shown in Fig. 4(a). Figure 4(b) shows the electron diffraction pattern of area S1. As shown in Fig. 4(b), the space group is Fm-3m. Combined with the elemental proportion of S1, it can be determined that S1 is Sm2Zr2O7. Other areas in Fig. 4(a) are tested in the same way, and they are all Sm2Zr2O7. This suggests that Z1 with Ca and Si free area is not corroded by CMAS. This dividing line is the boundary of the reaction zone and unreactive zone. This proves that the reaction product protects the Sm2Zr2O7 ceramic from CMAS corrosion.
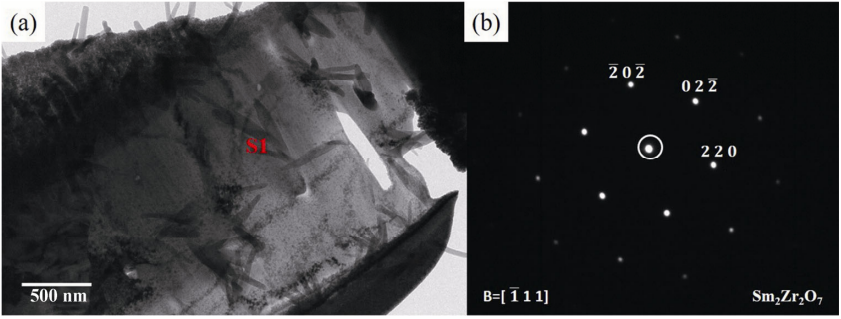
Fig. 4 (a) TEM image and (b) electron diffraction pattern of the light center.
To study the effect of reaction products on corrosion, the boundary areas of the reaction zone and unreactive zone close to Sm2Zr2O7 are analyzed by TEM, and the results are shown in Fig. 5. Figure 5(a) is a TEM bright field image of the reaction boundary areas close to Sm2Zr2O7. As shown in Fig. 5(a), there is an obvious boundary between two different micromorphologies. As shown in the dotted line in Fig. 5, the energy spectrum of the S2 and S3 areas was analyzed, and the results are shown in Table 2. No element of CMAS is found in area S2. S2 is Sm2Zr2O7. A small amount of Ca and Si elements of CMAS are found in area S3. S3 is SAED analyzed, and the results are shown in Fig. 5(b). The space group is Fm-3m. However, the lattice constant and the included angle are different from the standard value of Sm2Zr2O7. This suggests that Ca and Si enter the lattice of Sm2Zr2O7 and cause lattice distortion [25]. Therefore, S3 is the Si–Ca–Sm2Zr2O7 solid solution.
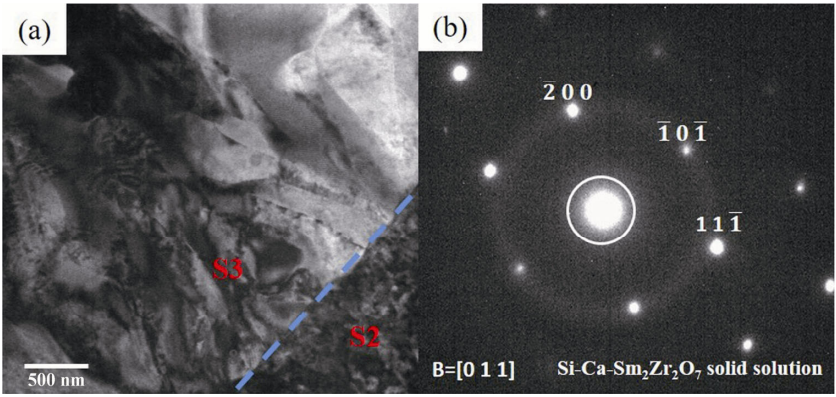
Fig. 5 (a) TEM image and (b) electron diffraction pattern of the boundary areas close to Sm2Zr2O7.
Table 2 Energy spectra of S1–S8

Figure 6 is a TEM bright field image of the reaction boundary areas close to CMAS. As shown in Fig. 6(a), there are some small grains with different sizes, which include some spherical crystal grains (S4) and some rod crystal grains (S5). The energy spectra of areas S4 and S5 are analyzed, and the results are shown in Table 2. S4 and S5 are SAED analyzed, and the results are shown in Figs. 6(b) and 6(c). The space group of S4 is P63/m, and the space group of S5 is Fm-3m. Combining the XRD results and elemental proportions of S4 and S5, it can be determined that S4 is Ca2Sm8(SiO4)6O2 and S5 is a c-ZrO2 solid solution.
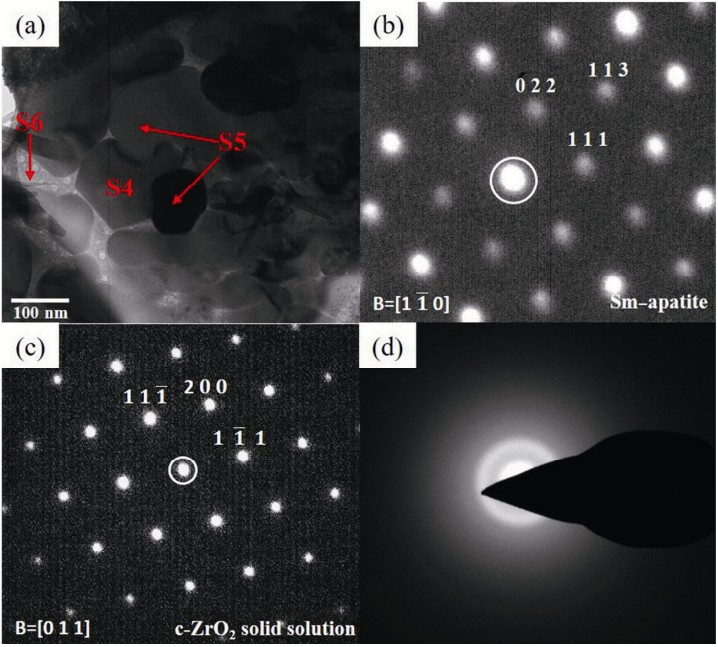
Fig. 6 (a) TEM image of the boundary areas close to CMAS, (b) selected area electron diffraction pattern of S4, (c) selected area electron diffraction pattern of S5, and (d) selected area electron diffraction pattern of S6.
The light color area of S6 is SAEDP analyzed, and the results are shown in Fig. 6(d). The electron diffraction pattern of S6 is diffuse scattering, which infers that S6 is amorphous. The results of the energy spectrum of S6 are shown in Table 2. Ca, Si, Mg, and Al elements of CMAS are found in area S6. Therefore, S6 is CMAS. As can be seen in Table 2, the content of Ca in S6 is 13.5 at%. Compared with the elemental proportions of C38M5A8S49, the content of Ca in S6 decreases significantly. S6 is surrounded by Ca2Sm8(SiO4)6O2 and c-ZrO2 solid solution, which dissolve part of Ca from S6. This leads to the content of Ca in S6 decreasing significantly.
In addition, there are loose areas after the reaction in Fig. 3(b). To study why protection against CMAS fails, the loose areas after reaction are analyzed by TEM, and the results are shown in Fig. 7. Figure 7(a) is a TEM bright field image of the loose area after the reaction. As shown in Fig. 7(a), unlike the reaction boundary areas, the grains in this area are relatively loose. There is a large amount of residual CMAS. The closer to the CMAS direction, the larger the grain size. Figure 7(b) is a TEM high-power bright field image of the loose area after the reaction. The rod crystal grains (S7) are larger than those in Fig. 6. Area S8 is deformed aspherical crystal grains, and S9 is CMAS. The results of the energy spectra of S7 and S8 are shown in Table 2. Zr, Sm, and Ca are found in area S7. Sm, Ca, Si, and Zr elements are found in area S8. S7 and S8 are SAEDP (selected area electron diffraction pattern) analyzed, and the results are shown in Figs. 7(c) and 7(d). Combined with the elemental proportions of S7 and S8, it can be determined that S7 is a c-ZrO2 solid solution (the space group is Fm-3m) and S8 is Ca2Sm8(SiO4)6O2 (the space group is P63/m). S9 is residual CMAS. Compared with the elemental proportions of C38M5A8S49 and S6, the content of Ca in S9 decreases significantly. This is consistent with S6. In addition, the content of Si in S9 decreases from 49 to 40.67 at%. This is because Ca2Sm8(SiO4)6O2 grain growth requires more Si from CMAS.
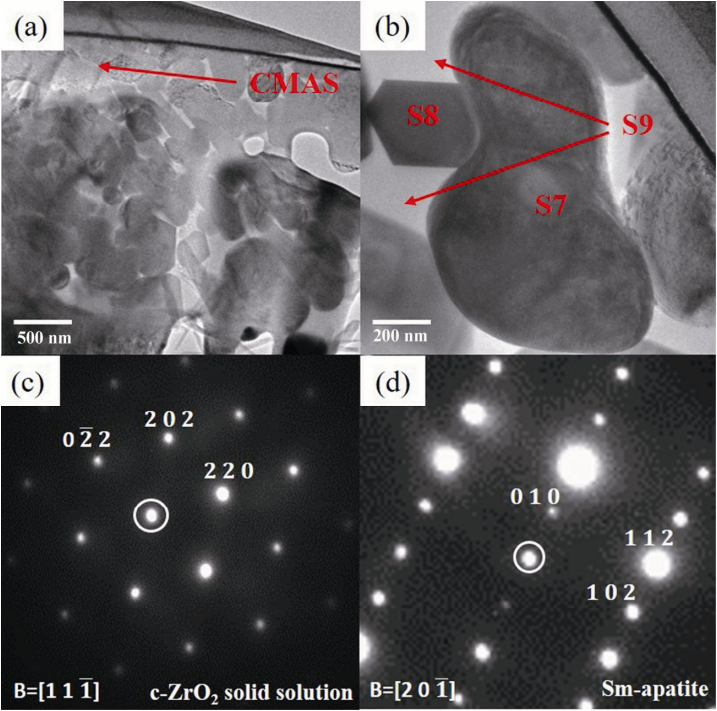
Fig. 7 (a) TEM image of the loose areas after reaction, (b) enlarged TEM view of the loose area after the reaction, (c) selected area electron diffraction pattern of S7, and (d) selected area electron diffraction pattern of S8.
The common apatite crystal (space group is P63/m) formula is A4IA6II(SiO4)6Ox [26]. AI and AII are alkali metal ions (A1+), alkali earth metal ions (A2+), or rare earth ions (A3+), and x is determined by the ionic valence of A. The coordination numbers of AI and AII are 9 and 7 [27], respectively. In Sm–apatite, AI tends to be occupied by Ca2+ with a larger ion radius. AII tends to be occupied by Sm3+ with a smaller ion radius. Because the radii of Ca2+ (118 pm) [28] and Sm3+ (113 pm) [29] are similar, Sm3+ may account for up to half the seat of AI. Therefore, it forms A2IA8II(SiO4)6O2 Sm–apatite, and the formula is (Ca2Sm2)Sm6(SiO4)6O2. According to the energy spectrum, the content of Sm in apatite is high. There is a small amount of Zr in the Sm–apatite. This is because Zr4+ may account for the seat of AI or AII. The radius of Zr4+ (72 pm) [30] is smaller than those of Ca2+ and Sm3+. Therefore, Zr4+ tends to occupy AII. Due to the introduction of Zr4+, to achieve charge conservation, the low valence cation should increase and the high valence cation should decrease in AI. Therefore, Ca2+ in AI increases and Sm3+ in AI decreases. And the change in the number of cations causes vacancies to appear in AI. It can be inferred that the chemical formula of Sm–apatite is (Ca1+xSm1−yEy−x)(Sm1−xZrx)6(SiO4)6O2, where E is the vacancy. In the following, it is called Sm–apatite for short.
The image of Sm2Zr2O7 powders corroded for 4 h at 1350 is shown in Fig. 8(a). As shown in Fig. 8(a), ℃ all Sm2Zr2O7 powders are corroded by CMAS. There are no P1 with core–shell structures. Figure 8(b) shows only rod crystal grains (Z5) and spherical crystal grains (Z6). The elements of Z5 and Z6 are shown in Table 3. According to the reaction results for 1 h, Z5 are Sm–apatite, and Z6 are c-ZrO2 solid solution. This suggests that all Sm2Zr2O7 powders are completely corroded by CMAS after a 4 h reaction. In addition, compared with the results of reaction for 1 h, it can be found that the contents of Sm, Ca, and Si in c-ZrO2 solid solution decrease.
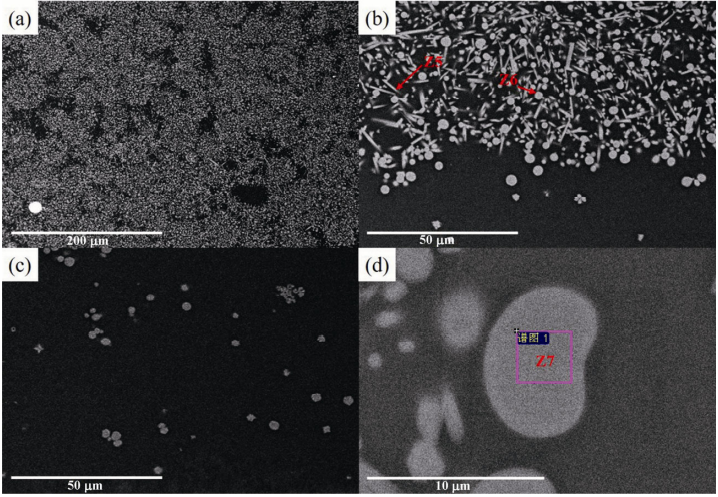
Fig. 8 (a) Image of Sm2Zr2O7 powders corroded for 4 h at 1350℃, (b) partial enlarged view of (a), (c) image of Sm2Zr2O7 powders corroded for 24 h at 1350℃, and (d) partial enlarged view of (c).
Table 3 Elements of Z1–Z8
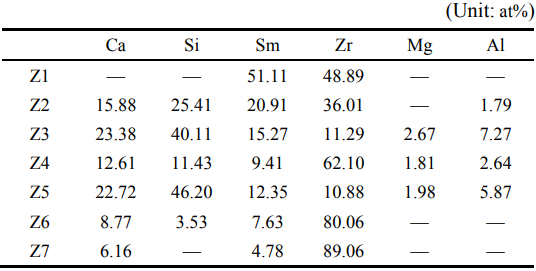
The image of Sm2Zr2O7 powders corroded for 24 h at 1350 is shown in Fig. 8(c). It can be found that ℃ there are only Z5 in CMAS. No S4 exist in this situation. The elements of Z7 (in Fig. 8(d)) are also shown in Table 3. Based on the previous results, the Z5 are still c-ZrO2 solid solution. Compared with the results of the contents of elements in Z6, there is no Si in the c-ZrO2 solid solution. The contents of Sm and Ca are reduced.
CMAS and Sm2Zr2O7 react to form Sm–apatite and c-ZrO2 solid solution, which can block the diffusion of the elements in CMAS at the beginning of the reaction. With increasing reaction time from 1 h to 4 h, the Sm2Zr2O7 powders are completely corroded by CMAS. This is because of the excess CMAS in the reaction. Excessive CMAS makes the barrier fail. Compared with 1 h sample, the grains of the Sm–apatite and c-ZrO2 solid solution grew. However, from 4 to 24 h, Sm–apatite gradually disappeared until it was gone completely. It is speculated that Sm–apatite is completely dissolved in excessive CMAS. The c-ZrO2 solid solution remains.
According to the above process, the corrosion model of excessive CMAS to Sm2Zr2O7 material is established and shown in Fig. 9. First, CMAS melts at approximately 1200 [24]. Liquid CMAS spreads on the surface of ℃ Sm2Zr2O7. Then, Ca and Si in CMAS mainly diffuse into Sm2Zr2O7, which results in lattice distortion of Sm2Zr2O7. Zr and Sm in Sm2Zr2O7 also diffuse into CMAS at the same time. When the content of Zr in CMAS is greater than its solubility, Zr will reprecipitate from CMAS to form c-ZrO2. A small amount of Sm and Ca dissolve in c-ZrO2. A c-ZrO2 solid solution is formed. Meanwhile, Sm, which diffuses from Sm2Zr2O7, reacts with Ca and Si to form Sm–apatite. Because c-ZrO2 solid solution grains are close to Sm–apatite grains, Sm–apatite and c-ZrO2 solid solution constitute a dense barrier layer that can block the diffusion of the elements in CMAS. During the reaction, some small grains are devoured by large grains following Ostwald’s rule [31]. The c-ZrO2 solid solution and Sm–apatite grains will grow. However, as the reaction time further increased, Sm–apatite gradually dissolved in CMAS. This may be because the solubility of Sm is higher than that of Zr in CMAS. Sm in Sm–apatite can diffuse into CMAS completely. However, Zr in c-ZrO2 solid solution cannot. Therefore, only the c-ZrO2 solid solution remains. The disappearance of Sm–apatite breaks the tight bond between the c-ZrO2 solid solution and Sm–apatite. Therefore, the barrier layer will fail. CMAS will follow the above process and continue to corrode Sm2Zr2O7. It can be inferred that Sm2Zr2O7 will be completely corroded if the reaction time is long enough. In the end, only some c-ZrO2 solid solution grains remain.
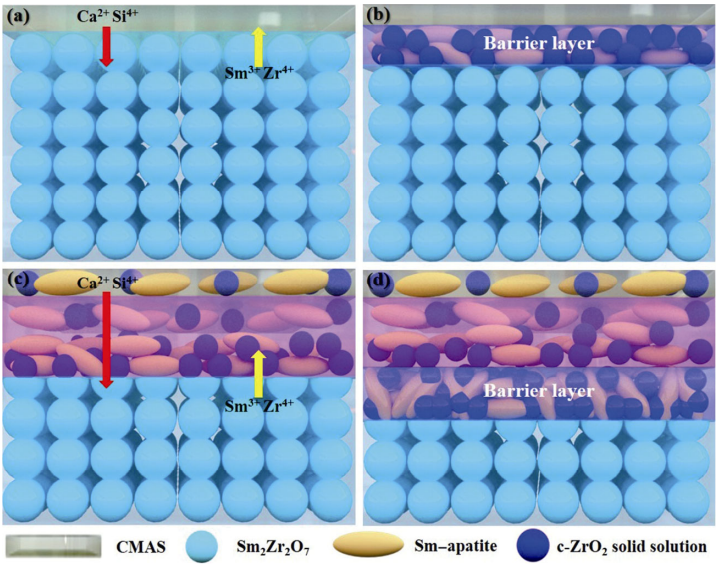
Fig. 9 Corrosion model of excessive CMAS to Sm2Zr2O7, (a) initial stage of corrosion, (b) middle stage of corrosion, (c) late stage of corrosion, and (d) initial stage of a new round corrosion.
4 Conclusions
The Sm2Zr2O7 powders were uniformly placed on the top surface of the CMAS glass and heat-treated at 1350 for 1, 4, and 24 h. ℃ After 1 h of reaction, Sm2Zr2O7 powders were not completely corroded. P2 and P1 with core–shell structures were formed. The reaction products were Sm–apatite and c-ZrO2 solid solution. Furthermore, because c-ZrO2 solid solution grains were close to Sm–apatite grains, Sm–apatite and c-ZrO2 solid solution constituted a dense barrier layer that can block the diffusion of the elements in CMAS. After 4 h of reaction, partly corroded powders disappeared, and all Sm2Zr2O7 was corroded. The content of Sm–apatite in the reaction product decreased. The grains of Sm–apatite and c-ZrO2 solid solution grew. After 24 h of reaction, Sm–apatite disappeared, and the c-ZrO2 solid solution remained. The disappearance of Sm–apatite broke the tight bond between the c-ZrO2 solid solution and Sm–apatite, which is the main reason for barrier layer failure.
References
[1] Padture NP, Gell M, Jordan EH. Thermal barrier coatings for gas-turbine engine applications. Science 2002, 296: 280–284.
[2] Ye DD, Wang WZ, Zhou HT, et al. Characterization of thermal barrier coatings microstructural features using terahertz spectroscopy. Surf Coat Technol 2020, 394: 125836.
[3] Zhu W, Li ZY, Yang L, et al. Real-time detection of CMAS corrosion failure in APS thermal barrier coatings under thermal shock. Exp Mech 2020, 60: 775–785.
[4] Gomez Chavez JJ, Naraparaju R, Mechnich P, et al. Effects of yttria content on the CMAS infiltration resistance of yttria stabilized thermal barrier coatings system. J Mater Sci Technol 2020, 43: 74–83.
[5] Li DX, Jiang P, Gao RH, et al. Experimental and numerical investigation on the thermal and mechanical behaviours of thermal barrier coatings exposed to CMAS corrosion. J Adv Ceram 2021, 10: 551–564.
[6] Yin BB, Sun M, Zhu W, et al. Wetting and spreading behaviour of molten CMAS towards thermal barrier coatings and its influencing factors. Results Phys 2021, 26: 104365.
[7] Tan ZY, Yang ZH, Zhu W, et al. Mechanical properties and calcium–magnesium–alumino–silicate (CMAS) corrosion behavior of a promising Hf6Ta2O17 ceramic for thermal barrier coatings. Ceram Int 2020, 46: 25242–25248.
[8] Han SH, Zhang JJ, Li TJ. Corrosion behavior and failure prediction of YSZ coatings under CMAS attack. J Therm Spray Technol 2021, 30: 708–715.
[9] Zhou PF, Li GF, Zhang YQ, et al. Infiltration mechanism of Ca–Mg–Al–silicate (CMAS) melt on Yttria stabilized zirconia (YSZ) columnar crystal at high temperature: First-principles research. Appl Surf Sci 2020, 513: 145712.
[10] Boissonnet G, Chalk C, Nicholls JR, et al. Thermal insulation of YSZ and erbia-doped yttria-stabilised zirconia EB-PVD thermal barrier coating systems after CMAS attack. Materials 2020, 13: 4382.
[11] Suresh G, Seenivasan G, Krishnaiah MV, et al. Investigation of the thermal conductivity of selected compounds of gadolinium and lanthanum. J Nucl Mater 1997, 249: 259–261.
[12] Lehmann H, Pitzer D, Pracht G, et al. Thermal conductivity and thermal expansion coefficients of the lanthanum rare-earth-element zirconate system. J Am Ceram Soc 2003, 86: 1338–1344.
[13] KuttyKVG, Rajagopalan S, Mathews CK, et al. Thermal expansion behaviour of some rare earth oxide pyrochlores. Mater Res Bull 1994, 29: 759–766.
[14] Li MZ, Cheng YX, Guo L, et al. Preparation of nanostructured Gd2Zr2O7–LaPO4 thermal barrier coatings and their calcium–magnesium–alumina–silicate (CMAS) resistance. J Eur Ceram Soc 2017, 37: 3425–3434.
[15] Gok MG, Goller G. Microstructural characterization of GZ/CYSZ thermal barrier coatings after thermal shock and CMAS+hot corrosion test. J Eur Ceram Soc 2017, 37: 2501–2508.
[16] Drexler JM, Ortiz AL, Padture NP. Composition effects of thermal barrier coating ceramics on their interaction with molten Ca–Mg–Al–silicate (CMAS) glass. Acta Mater 2012, 60: 5437–5447.
[17] Gao LH, Guo HB, Gong SK, et al. Plasma-sprayed La2Ce2O7 thermal barrier coatings against calcium– magnesium–alumina–silicate penetration. J Eur Ceram Soc 2014, 34: 2553–2561.
[18] Gledhill AD, Reddy KM, Drexler JM, et al. Mitigation of damage from molten fly ash to air-plasma-sprayed thermal barrier coatings. Mater Sci Eng: A 2011, 528: 7214–7221.
[19] Li T, Ma Z, Liu L, et al. Thermal properties of Sm2Zr2O7–NiCr2O4 composites. Ceram Int 2014, 40: 11423–11426.
[20] Wang DY, Liu L, Liu YB, et al. Heat insulating capacity of Sm2Zr2O7 coating added with high absorptivity solids. Ceram Int 2017, 43: 2884–2887.
[21] Bons JP, Crosby J, Wammack JE, et al. High-pressure turbine deposition in land-based gas turbines from various synfuels. J Eng Gas Turbines Power 2007, 129: 135–143.
[22] Crosby JM, Lewis S, Bons JP, et al. Effects of temperature and particle size on deposition in land based turbines. J Eng Gas Turbines Power 2008, 130: 051503.
[23] Müller D, Hess KU, Kueppers U, et al. Rheological and chemical interaction between volcanic ash and thermal barrier coatings. Surf Coat Technol 2021, 412: 127049.
[24] Zhang X, Shan X, Withers PJ, et al. Tracking the calcium–magnesium–alumino–silicate (CMAS) infiltration into an air-plasma spray thermal barrier coating using X-ray imaging. Scripta Mater 2020, 176: 94–98.
[25] Brik MG, Srivastava AM. Pyrochlore structural chemistry: Predicting the lattice constant by the ionic radii and electronegativities of the constituting ions. J Am Ceram Soc 2012, 95: 1454–1460.
[26] Kazin PE, Zykin MA, Trusov LA, et al. Multiple slow relaxation of magnetization in Dy3+ confined in the crystal matrix of rare-earth-calcium silicates with the apatite structure. Dalton Trans 2020, 49: 2014–2023.
[27] Krämer S, Yang J, Levi CG. Infiltration-inhibiting reaction of gadolinium zirconate thermal barrier coatings with CMAS melts. J Am Ceram Soc 2008, 91: 576–583.
[28] Peng WY, Zevalkink A. Limits of cation solubility in AMg2Sb2 (A = Mg, Ca, Sr, Ba) alloys. Materials 2019, 12: 586.
[29] Sangwaranatee N, Yasaka P, Rajaramakrishna R, et al. Photoluminescence properties and energy transfer investigations of Gd3+ and Sm3+ co-doped ZnO–BaO–TeO2 glasses for solid state laser application. J Lumin 2020, 224: 117275.
[30] Zhang Y, Guo L, Zhao XX, et al. Toughening effect of Yb2O3 stabilized ZrO2 doped in Gd2Zr2O7 ceramic for thermal barrier coatings. Mater Sci Eng: A 2015, 648: 385–391.
[31] Zimmermann HW. Ostwald’s rule and the principle of the shortest way. Zeitschrift Für Physikalische Chemie 2010, 224: 929–934.
Declaration: This article is provided by CERADIR™ users or obtained from Internet, the content does not represent the position of CERADIR™. We are not responsible for the authenticity/accuracy of the article, especially the effects of the products concerned. This article is for study only, it does not constitute any investment or application advice. For reprinting, please contact the original author. If it involves the copyright and/or other issues, please contact us and we will deal with it asap! CERADIR™ has the interpretation of this declaration.