Abstract: Ceramic coatings can effectively prevent the corrosion of steel bars in marine environments. In this study, we prepared phosphate ceramic coatings on the surface of carbon steel. X-ray diffraction and X-ray fluorescence were used to analyze the phase structure and composition of the ceramic and the results show that the main crystal composition of ceramic is P2O5 and SiO2. Scanning electron microscopy was used to characterize the morphology of the surface and the section and results showed that the surface was cracked, and the thickness of ceramic was 349 μm. Meanwhile, a number of high-resolution images of internal structure of solids were obtained by non-destructive X-ray computed tomography (X-CT). Matlab and Mimics software were used to conduct the three-dimensional reconstruction of the CT images. Matrix and holes are distinguished by threshold segmentation in grayscale images, and the porosity of the ceramic coatings was calculated to be 14.0%. In addition, mercury intrusion porosimetry was used to verify the calculation results. Therefore, X-CT can be a useful and reliable tool for the visualization of the internal structure of ceramic coatings.
Key words: ceramics; porosity; X-CT technology; 3D reconstruction
Reinforced concrete structures are widely used due to their high performance and low cost of their constituent raw materials[1]. Owing to construction of a large amounts of infrastructure, consumption of cement is increasing yearly as the amount of concrete and steel rebar.
Owing to the presence of holes in concrete, aggressive ions penetrate the concrete and reach the surface of steel rebar, which destroy the passive film on the steel surface[2].
In particular, under an offshore aggressive environment, dry and wet cycling conditions accelerate the transmission of harmful ions. The corroded steel bars undergo stress expansion and the fluffy corrosion products reduce adhesion to the concrete, which cause premature deterioration of civil infrastructures, leading to serious consequences[3]. Therefore, various methods have been used to isolate ions and protect carbon steel, such as ceramic coatings[4], green inhibitors[5], corrosion-resistant steel bars[6], and photogenerated electron cathodic protection[7]. Among these methods, protective ceramic coatings are the most applied and studied methods. Tang, et al.[8] prepared different enamel coatings, and they found that three types of intact ceramic coatings significantly outperformed fusion-bonded expoxy coatings. However, due to the presence of microscopic isolated pores, the properties of the three ceramics are not completely identical. Traditional test methods such as scanning electronic microscopy (SEM) can only characterize the shape of the hole in the ceramic surface and cannot calculate the specific porosity of the entire ceramic. Moreover, mercury intrusion porosimetry (MIP) has been widely used to determine the pore-size distribution (PSD) for most materials, from which a wide range of pore sizes can be found[9]. However MIP can only detect the local zone of the sample and the tests depend on the assumption that the pores are cylindrical, which cannot reflect the actual pore pattern[10]. Therefore, it is necessary and vital to develop a new approach to calculate the porosity of ceramic coatings and to devise a new and improved model of the relationship between the transmission rate of ions and the porosity of ceramic coatings.
X-ray computed tomography (X-CT) is mostly used in medicine, in which computer-processed X-ray data are used to construct images of bone, the brain, organs, etc[11].
Two-(2D) or three-dimensional (3D) reconstruction of a test structure can be achieved by computer technology, which makes the internal structure able to be more intuitively explored. Therefore, it is convenient to analyze the pore structure of ceramic solid materials non-destructively[12]. In previous research, Yang, et al. [13] revealed the in situ tracking of water transport in cement paste using X-CT, in which CsCl was added to the water to enhance the contrast. 3D representations of ceramics are achievable at
different pore sizes and provide a way to observe the evolution of pores, which is useful in understanding the failure mechanism of ceramic coatings[14].
In this study, X-CT was applied to porosity calculations of ceramic coatings, which is an important parameter for the transport of aggressive ions inside ceramic structures. 2D and 3D images were generated and the threshold segmentation technique was used to distinguish the pores and substrate. Furthermore, MIP was used to study the porosity and pore size distribution, which provide mutual authentication of the X-CT test results of the porosity of ceramic coatings.
1 Experiments
1.1 Materials
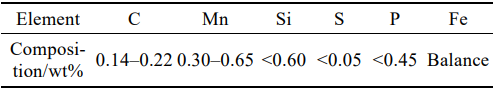
A phosphate ceramic coating was supplied by Eoncoat Coating (Eoncoat Coating Technology Co. Ltd., Beijing, China) and was used without any further alteration. Q235 carbon steel was used and its content is shown in Table 1[5]. First, the carbon steel with the size of Φ20 mm×10 mm, was sand-blasted to remove the surface oxide and achieve a rough surface. Then, the ceramic coating was sprayed onto the surface 10 times to prepare the coating. The resolution of X-CT images is related with the sample size, and smaller size provides higher definition. Therefore a piece of ceramic coating was peeled off from the carbon steel coating as test sample to obtain the highresolution picture.
Before the test, the ceramic bulk was dried at 50 ℃ in air oven for 3 h. After cooling to room temperature, epoxy resin was used to wrap and fix the ceramic. The ceramic was then ground in agate mortar to obtain the powder used in X-ray diffraction (XRD), X-ray fluorescence (XRF) and high-resolution transmission electron microscopy (HRTEM) experiments.
1.2 Characterization
The phase structure was detected by XRD (Bruker D8 Discover) from 10° to 80° at 0.02 (°)/s. The chemical composition was determined using XRF (Bruker S4 Pioneer) at 40 kV and 100 mA[15]. SEM (Navo Nano SEM450, 30 kV) with Energy Dispersive X-ray Spectroscopy (EDS) was used to determine the morphology of the ceramic surface and section[16-17]. TEM and HRTEM were used to get the morphology of nanosize oxide particles. MIP was performed on a Micrometrics Autopore IV 9500. A contact angle of 130° was assumed. The pressure ranged from 1.5×10⁴ Pa to 6.1×10⁴ Pa. CT scan test was performed on a Y. CT Precision S X-CT system (YXLON, Germany) with resolution of 1024×1024 pixels[18]. The images were pre-processed in MatLab R2016a software (MathWorks, USA), and the 2D or 3D image reconstructions and porosity calculated using Mimics research software.
Table 1 Composition of carbon steel Q235
2 Results and discussion
2.1 Phase composition analysis
2.1.1 XRD analysis
The phase composition and crystal structure of the as-prepared ceramic were examined by XRD. As shown in Fig. 1, the main constituents of the ceramic are P2O5
(JCPDS 23-1301), SiO2 (JCPDS 27-0605), which correspond to the lattice plane of (111), (111). There are two crystal structures of TiO2 in ceramic, which are ascribed
to the lattice planes of (110) and (101) for rutile TiO2 (JCPDS 21-1276) and anatase TiO2 (JCPDS 21-1272), respectively[19]. Also, there are a small amount of CaO, Fe2O3 and MgO4, with JCPDS 50-1575, 40-1139 and 27-0759, respectively. Furthermore, the novel type of zeolite in the system of K2O-Na2O-Al2O3-SiO2-H2O with JCPDS 43-0050 was detected.
2.1.2 XRF analysis
The XRF results of the as-prepared ceramic coatings, expressed in oxide form, are presented in Table 2. The XRF analysis showed that the main phase composition of ceramic is P2O5, SiO2, K2O, and MgO with a total amount of 81.55wt%. And a small amount of Al2O3, CaO, and TiO2, and the balance being Na2O/SO3/Fe2O3/ZnO. The main reason for the detection of oxides of Al2O3 and ZnO in XRF test but not in XRD test is that the content of oxide is too small to be detected. The XRF results are completely consistent with the results of the XRD analysis.
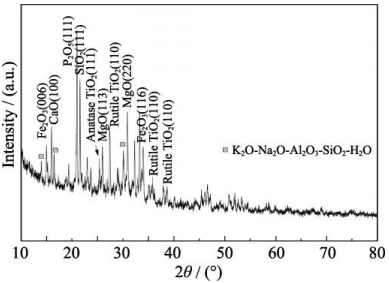
Fig. 1 XRD pattern of as-prepared ceramic coating
Table 2 Chemical analysis determined by XRF of the as-prepared ceramic coating

2.2 SEM analysis
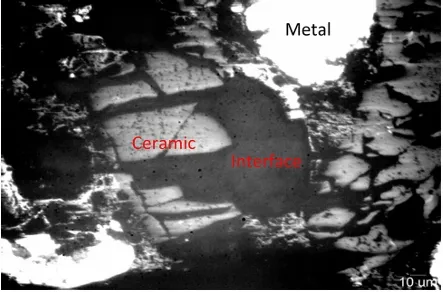
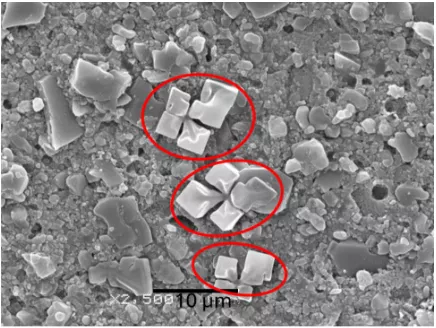
SEM is a useful technology to study the morphology of the surfaces and sections of the ceramic coatings. Fig. 2(a) shows the surface SEM image of the ceramic coating. It can be seen that the ceramic coating was a stable whole and the surface is rough. However, the oxide particles are not packed densely, resulting in the pore between the oxide particles. Inset is EDS analysis of area #1 shown in Fig. 2(a), which reveals that the main constituents of the ceramic are P, Si, Mg, Fe and K, in good agreement with the XRD and XRF analysis results. Furthermore, the section morphology of the ceramic and steel is shown in Fig. 2(b), demonstrating that the thickness of the ceramic coating is 349 μm and, moreover, that the ceramic coating is tightly bonded to the steel bars. In addition, microcracks are seen in the section, which may be caused by the difference in thermal expansion coefficients between the ceramic coating and the steel.
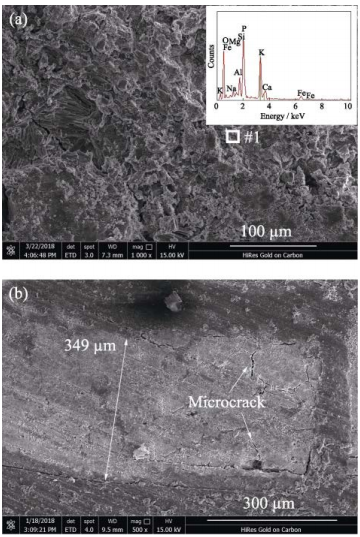
Fig. 2 Surface (a) and section (b) SEM images of the as-prepared ceramic coating
Inset in (a) is the EDS analysis of area #1
2.3 TEM and HRTEM analysis
TEM and HRTEM images of the ceramic coating are shown in Fig. 3 which provide more detailed latticeparameter information regarding the oxide in the ceramic coating. As shown in Fig. 3(a), the coating powder has a plate-like structure, which has been superimposed to form a cluster. Fig. 3(b) clearly shows two sets of lattice fringes with lattice spacings of 0.327 and 0.285 nm, corresponding to the (110) and (420) planes of TiO2 and P2O5, respectively, which is consistent with XRD results.
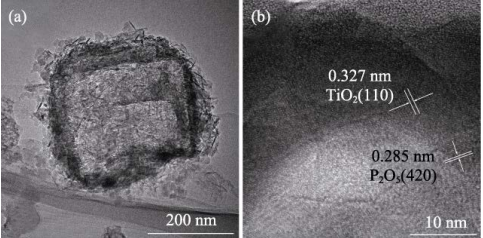
Fig. 3 (a) TEM and (b) HRTEM images of ceramic coating
2.4 3D reconstruction and porosity analysis
The evolution of ceramic-coating porosity was monitored by the X-CT system. First, eight hundred highresolution CT high resolution images were obtained after the X-CT test. Pre-processing was performed using Matlab to remove the edge portion of images, such as epoxy resin. The raw X-CT picture is shown in Fig. 4(a) and cropped by Matlab according the red dotted line. The cutting pictures were imported in Mimics Research software. In Mimics software, we can distinguish the hole structure and substrate by threshold segmentation of grayscale value, and results of the division for the end face and side face are shown in Figs. 4(b, c), in which the green part represents the hole and the yellow part represents the substrate. Then 2D pictures with segmentation of grayscale value were 3D reconstructed by Mimics Research software immediately. 3D reconstructions of the hole structure and substrate can be formed by overlay analysis of the high resolution images and are shown in Figs. 4(d, e), respectively. In addition, the volumes of the hole and substrate can be calculated in Mimics software by counting the total amount of the green and yellow areas and marked as Vhole and Vsub, respectively. Then the porosity can be calculated by the following equation:
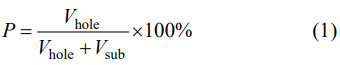
where P is the porosity of ceramic coating. In this work the calculated value of P is 14.0%. A lower porosity of ceramic leads to a lower transmission rate for the aggressive ions. Therefore, a lower porosity ceramic coating can effectively prevent the migration of chloride ions to the surface of the carbon steel and avoid corroding the steel rebar.
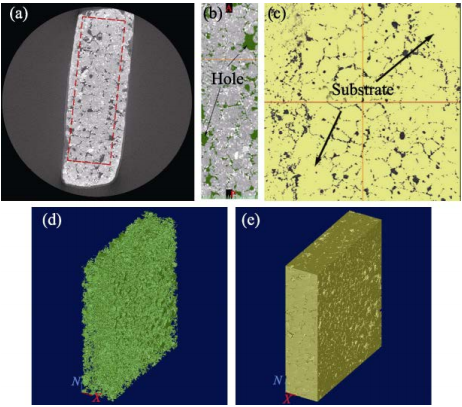
Fig. 4 CT images of ceramic coating
(a) Raw X-CT image; (b, c) Threshold segmentation of (b) hole structure and (c) substrate structure; (d, e) 3D reconstruction of (d) hole and(e) substrate
MIP test was used to further verify the porosity of ceramic, and the pore structure and pore size distribution (PSD) were shown in Fig. 5. There are two critical pore diameters, one is less than 10 nm, and another is between 1 μm to 10 μm. Pore diameter less than 10 nm is the gel pores of oxide substrate[20]. And the highest peak in the pore entry size distribution from 1 μm to 10 μm is the gap between the oxides, which is shown in Fig. 5. The porosity obtained by the MIP is 12.275%, which is close to the calculated result by the X-CT. The MIP test confirms that the X-CT can be a fast and non-destructive method to measure the porosity.
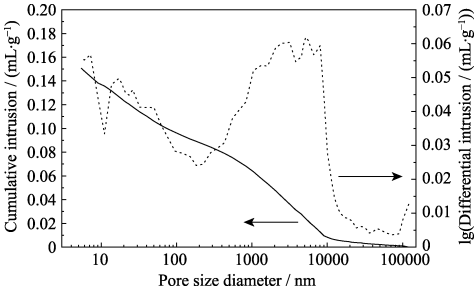
Fig. 5 Pore size distribution test by MIP: cumulative intrusion (mL/g) and lg(differential intrusion/(mL∙g–1))
3 Conclusions
Ceramic coatings are very effective materials that provide corrosion-protection for steel. However, due to the different thermal expansion coefficient of the steel matrix, microcracks and holes are present in ceramic coatings. X-CT can reveal the internal hole structure nondestructively, i.e., the hole and substrate are distinguished by threshold segmentation. 3D reconstruction the hole and substrate structure can be achieved by analyzing the CT images with Matlab and Mimics. By calculating of hole volume and the volume of the substrate, the porosity of the ceramic coating was calculated as 14%. By the MIP test, the porosity of ceramic coating is 12.275%, which is close to the calculation result of X-CT. The main pore structure is the gel pores of oxide and gap between the oxides. Therefore, it can be seen that X-CT technology is a useful and reliable technique to calculate the porosity of solid material.
References:
[1] YANG J J, HAI R, WU K R. Effect of ettringite structural transformation on expansive behavior of expansion cement. Journal of Inorganic Materials, 2003, 18(1): 136–142.
[2] LÜ J L, JIN H J, LIANG T X. The effect of electrochemical nitridationon the corrosion resistance of the passive films formed on the 2205 duplex stainless steel. Materials Letters, 2019, 256: 1–4.
[3] ZHAO Y P, LIU Y, LIU Q, et al. Icephobicity studies of superhydrophobic coatings on concrete via spray method. Materials Letters, 2018, 233: 263–266.
[4] WANG P S. Study on Preparation and Critical Properties of a New Type of Steel Bars Coated with Micro/Nano Ceramics. Nanjing: Master Thesis of Southeast University, 2016.
[5] ZHANG Z F, WANG F J, LIU Y, et al. Molecule adsorption and corrosion mechanism of steel under protection of inhibitor in a simulated concrete solution with 3.5% NaCl. RSC Advances, 2018, 8: 20648.
[6] JIANG J Y, CHU H Y, LIU YAO, et al. Galvanic corrosion of duplex corrosion-resistant steel rebars under carbonated concrete conditions. RSC Advances, 2018, 8: 16626.
[7] WEI Q Y, WANG X T, NING X B, et al. Characteristics and anticorrosion performance of WSe2/TiO2 nanocomposite materials for 304 stainless steel. Surface and Coatings Technology, 2018, 352: 26–32.
[8] TANG F J, CHEN G D, BROWN R K, et al. Corrosion resistance and mechanism of steel rebar coated with three types of enamel. Corrosion Science, 2012, 59: 157–168.
[9] CUI D, BANTHIA N, WANG Q N, et al. Investigation on porosity of partly carbonated paste specimens blended with fly ash through dual CT scans. Construction and Building Materials, 2019, 196: 692–702.
[10] LUBELLI B, WINTER D A M, POST J A, et al. Cryo-FIB-SEM and MIP study of porosity and pore size distribution of bentonite and kaolin at different moisture contents. Applied Clay Science, 2013, 80–81: 358–365.
[11] COLLINGWOOD J F,ADAMS F. Chemical imaging analysis of the brain with X-ray methods. Spectrochimica Acta Part B: Atomic Spectroscopy, 2017, 130: 101–118.
[12] HERMANEK P, CARMIGNATO S. Porosity measurements by X-ray computed tomography: accuracy evaluation using a calibrated object. Precision Engineering, 2017, 49: 377–387.
[13] YANG L, ZHANG Y S, LIU Z Y, et al. In-situ tracking of water transport in cement paste using X-ray computed tomography combined with CsCl enhancing. Materials Letters, 2015, 160: 381–383.
[14] ZHU W, CAI X N, YANG L, et al. The evolution of pores in thermal barrier coatings under volcanic ash corrosion using X-ray computed tomography. Surface and Coatings Technology, 2019, 357: 372–378.
[15] ZHENG Y F, ZHANG L L, WANG K, et al. Microstructure characterization and luminescent property of mixed spinel Zn6Ga8TiO20:Cr3 phosphors. Journal of Inorganic Materials, 2018, 33(1): 9–13.
[16] LI Y T, CHEN L, GUO Y L, et al. Preparation and characterization of WO3/TiO2 hollow microsphere composites with catalytic activity in dark. Chemical Engineering Journal, 2012, 181–182: 734–739.
[17] ZHANG X F, ZHANG G H, MENG Y, et al. Photocatalytic degradation of methylene blue by schiff-base cobalt modified CoCr layered double hydroxides. Journal of Inorganic Materials, 2019, 34(9): 974–982.
[18] WAN K S, LI G, WANG S H, et al. 3D full field study of drying shrinkage of foam concrete. Cement and Concrete Composite, 2017, 82: 217–226.
[19] ZHANG Z Y, SANG L X, LU L P, et al. Preparation of TiO2 nanotube arrays and their photoelectrochemical properties. Journal of Inorganic Materials, 2010, 25(11): 1145–1149.
[20] KANG S H, HONG S G, MOON J. The effect of superabsorbent polymer on various scale of pore structure in ultra-high performance concrete. Construction and Building Materials, 2018, 172: 29–40.
Declaration: This article is provided by CERADIR™ users or obtained from Internet, the content does not represent the position of CERADIR™. We are not responsible for the authenticity/accuracy of the article, especially the effects of the products concerned. This article is for study only, it does not constitute any investment or application advice. For reprinting, please contact the original author. If it involves the copyright and/or other issues, please contact us and we will deal with it asap! CERADIR™ has the interpretation of this declaration.