Abstract: Tailoring physical properties in conductive ceramics is difficult, which is dominated by the continuous ceramic matrix. In this study, tunable anisotropic physical and mechanical properties in conductive ceramics were successfully realized by incorporating hexagonal boron nitride (hBN) flakes in their matrices. Two conductive TiB2-AlN-hBN ceramics (TAB) with different hBN contents were fabricated by spark plasma sintering using powder mixtures containing TiN, Al, boron and hBN. Perpendicular to the load direction, flexural strength, fracture toughness, electrical conductivity and thermal conductivity of TiB2-AlN-60 vol% hBN composites at room temperature were 151 ± 6.34 MPa, 2.62 ± 0.31 MPa m1/2, 5.3 × 10⁵ S m−1 and 77.87 W m−1 K−1. Whilst electrical conductivity and thermal conductivity decreased to 2.0 × 10⁵ S m−1 and 32.25 W m−1 K−1 at the direction parallel to the load. These differences were created just by incorporating small amounts of extra aligned hBN flakes in the conductive matrix, providing new opportunities to material selection and design.
Keywords: hexagonal boron nitride, texture, microstructure, mechanical property, physical property
INTRODUCTION
With a rapid development of advanced materials towards high power density and advanced integration, the ability to efficiently control heat transfer and intelligent electron transport becomes particularly important [1,2]. However, in some occasions, electrical and thermal properties required by the component in different directions are not exactly the same. Taking chip packaging as an example, it is demanded to insulate electrons out of plane and to dissipate heats in plane [3,4]. It is possible to create anisotropic characteristics in materials with non-cubic crystal systems, such as Si3N4, Bi2Te3, hexagonal boron nitride (hBN), and transition metal diborides (MB2), by grain orientation to regulate/maximize their performances and therefore expand applications [5–9]. Generally, ceramics with textured microstructures could be obtained by applying external stress, temperature and electromagnetic fields on their green body during processing and/or sintering. However, these methods faced different issues, such as duration, cost, level of complexity, and insignificant anisotropic degree, which affect the management of material anisotropy [10–12].
hBN is one of the most versatile structural materials with an outstanding combination of low density (2.27 g cm−3), high melting point (3000°C for decomposition in nitrogen), excellent thermal shock resistance, high thermal conductivity (100–400 W m−1 K−1) as well as a large band gap (~7.1 eV). These properties render hBN and hBN-containing ceramics (BNCC) numerous applications in thermal management, metallurgy, high-end electronics industry, etc. [13–15]. Recent results confirm hBN-based ceramics with higher density could be realized via cheaper approaches such as cold sintering and flash spark plasma sintering (FSPS) [16,17]. As a result of the lamellar structure bonded by weak van der Waals force and strong covalent bonding existing in their basal planes, hBN demonstrated obvious property anisotropy. For example, the theoretical band gaps parallel and perpendicular to the c-axis of hBN crystals were calculated to be 3.6 and 7.1 eV, respectively. The thermal conductivity in the direction parallel to the planes (>100 W m−1 K−1) is much higher than those of other directions (as low as ~4.1 W m−1 K−1) [18–23]. Consequently, based on the anisotropic performance of hBN, it may promote the modulation of thermal and electrical properties of BNCC in various directions if aligned hBN grains are formed in the composite matrix. Fortunately, hBN flakes could be easily oriented in the ceramic matrix, which has been confirmed in many material systems, e.g., TiB2-hBN, mullite-BN, SiC-BN, and AlON-BN[10,16,24,25]. Nevertheless, creating anisotropic physical properties in conductive ceramic matrices is still difficult and reports on tailoring their properties are also very rare.
In view of this, in this work, taking TiB2-AlN-hBN ceramics(TAB) with excellent thermo-physical properties as an example [26,27], by adding extra hBN flakes into the matrix, the purpose is to explore regulatory effects of hBN on the anisotropic mechanical and physical properties for multiphase conductive ceramics.
EXPERIMENTAL SECTION
Commercially available titanium nitride (TiN, D50 = 2 μm, purity ≥ 99.9%, Qinhuangdao ENO High-Tech Material Development Co., Ltd.), aluminum (Al, purity > 99.5%, D50 = 100 nm, Hunan Jinhao New Material Technology Co., Ltd.), boron (B, purity > 95%, Dandong Rijin Science and Technology Co., Ltd.) and hBN powder (D50 = 2 μm, flake thickness of 200 nm, purity ≥ 99.9%, Suzhou Nutpool Materials Technology Co., Ltd.) were chosen in this study. Stoichiometric powders according to the x variable in Reaction (1) were mixed with ethanol and 3Y-ZrO2 balls for 24 h in a multidirectional mixer, which were evaporated by rotation before drying. In this study, powder mixtures with two values (x = 0 and 5.98) were selected. Accordingly, hBN volume contents in the composites are 27% and 60%, which were named TAB27 and TAB60 for simplicity, respectively.
3TiN + Al + 8B + xhBN = 3TiB2 + AlN + (x + 2)hBN. (1)
As-dried powders were used to consolidate TAB27 and TAB60 in an SPS furnace (Type HPD 60/0). The temperature was elevated from 450 to 1800°C with a fixed heating rate of 100°C min−1, and kept at the peak temperature for 20 min under a constant pressure of 60 MPa to obtain highly dense samples with heights of ~25 mm to investigate their properties at different directions. Thereafter, the densities (d) of the as-sintered samples after surface grinding were measured by the Archimedes method. Their phase assemblages and fracture surfaces were characterized by X-ray diffraction (XRD, Empyrean series 3, Netherlands) analysis and an field-emission scanning electron microscope (FESEM, SU8230, Hitachi, Japan) equipped with an energy dispersive system (EDS, 170 mm², Ultim Max, Oxford Instruments, UK), respectively. Flexural strength (σf) at room temperature was tested using rectangular bars (2 mm × 2.5 mm × 25 mm) with a span width of 20 mm and a crosshead speed of 0.5 mm min−1. Fracture toughness (KIC) was measured by a single-edge notched beam (SENB) technique using rectangular bars (2 mm × 4 mm × 22 mm) with a notch of 1 mm in depth and ~0.2 mm in width. Elastic modulus (E) and Poisson’s ratio (ν) were measured by impulse excitation according to the ASTM Standard E 1876-01. Additionally, electrical resistivity measurements were conducted using a sample size of ~2 mm × 4 mm × 10 mm (thickness × width × length) by a four-probe method in a helium atmosphere at elevated temperatures. Thermal expansion coefficient (α) was measured using a sample size of ~2 mm × 3 mm × 20 mm (thickness × width × length) from 296 to 1273 K. Thermal diffusivities (μ) were measured using a laser flash technique. The size of the square sample was ~2 mm × 10 mm × 10 mm (thickness × width × length). Combined with specific heat capacity (Cp) values calculated from FactSage 8.2, the thermal conductivity (λ) as a function of temperature was calculated according to Equation (2). Thermal shock fracture factors (R and R′) and thermal shock damage factors (R′′′ and R′′′′) were used to evaluate the thermal shock resistance (Equations (3)–(6)). Here, γWOF represents the effective fracture energy.
λ = Cp × μ × d, (2)


RESULTS AND DISCUSSION
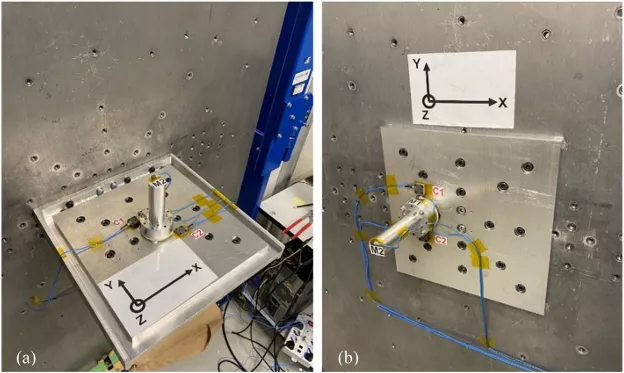
After sintering, measured densities for TAB27 and TAB60 were 3.62 and 3.01 g cm−3, correspondingly. TAB27 has a higher relative density of 98.9% compared with TAB60 (97.4%), which might be caused by the poor sinterability of additional hBN. Fig. 1a shows the orientation of samples for cutting and loading directions during property measurement. Fig. 1b, c display XRD patterns of top surface (TS) and side surface (SS) of TAB60 and TAB27. Unsurprisingly, desired phases were all detected in both samples. As shown in TAB60 (Fig. 1b), the intensity of (002) plane of hBN on its SS was much stronger than that on TS, implying that the c-axis of hBN in TAB60 tended to orientate parallel to the pressure direction. In contrast, in TAB27 (Fig. 1c), the hBN diffraction peaks of (002) and (100) planes on TS and SS were nearly identical to each other, revealing that the in-situ synthesized hBN grains without extra additions orientated almost randomly in the TiB2-AlN matrix.
The index of orientation preference (IOP) value was employed to quantitatively assess the degree of hBN grain orientation in TAB matrix, as described by Equation (7) [28]:

where Ihkl and I′hkl represent the intensities of corresponding diffraction rays measured vertically (numerator) and parallel (denominator) to the loading direction, respectively. As-calculated IOP values for TAB27 and TAB60 were −0.92 and −27.13, implying that increasing hBN amounts would facilitate their grain rearrangement and preferred orientation.
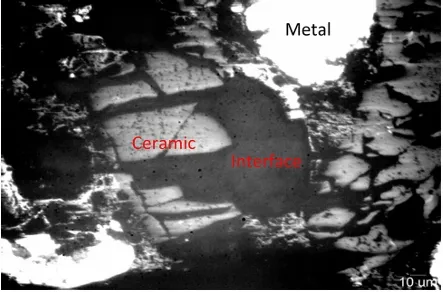
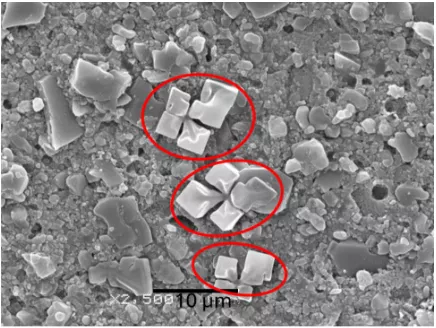
Fig. 2 compares typical morphologies of the fractured TAB27 and TAB60. As shown in TAB27 (Fig. 2a, b), both images were extremely resembled. In-situ hBN grains (black contrast) with an average size of ~1.5 μm in length and ~0.9 μm in thickness were homogeneously and isotopically dispersed in TiB2 grains (light contrast), which are irrelevant with loading directions. Furthermore, no apparent hBN grain orientation was observed, in accordance with the XRD analysis (Fig. 1c). As regard to TAB60, its fracture surface was rough when cracks propagated along the P1 direction (Fig. 2c). hBN flakes with ~8 μm in length and ~100 nm in thickness were well aligned, perpendicular to the SPS pressure direction. It was worth noting that their dimensions are almost four times larger than those of raw hBN powders (~2 μm). In addition to the easily observed light TiB2 grains, minor AlN grains (~1 μm) with grey contrast were well dispersed between pulled-out hBN flakes. Whereas their fracture surfaces were relatively flat when they were broken along the P3 direction (Fig. 2d), many hBN flakes with large plane areas and thin thicknesses could be detected. Such morphology difference was confirmed by revealing corresponding elemental mappings (Fig. 2e). It appeared that aligned hBN grains in TAB60 exhibited higher crystallization degree with no obvious in-plane defects observed, indicating the high thermal conductivity in TAB60.

Figure 1 (a) Schematic diagram showing the cutting and loading directions of the samples. XRD patterns collected from TS and SS of samples: (b) TiB2-AlN-60 vol% hBN (TAB60) and (c) TiB2-AlN-27 vol% hBN (TAB27).
Mechanical properties of TAB27 and TAB60, including flexural strength and fracture toughness, along three directions were listed in Table 1. Here, P1, P2 and P3 represented different loading directions, as illustrated in Fig. 1c. Critical crack length (c) values were calculated according to the Griffith equation (Equation (8)) and the geometric factor (Y) of a flaw was set as 1.4. In general, mechanical properties of TAB60 are lower than those of TAB27 along different directions since higher amounts of weak hBN flakes were introduced in the former one. In addition, mechanical properties and critical crack sizes of TAB27 along the three loading directions were close as excepted, while TAB60 with aligned hBN grains displayed strong anisotropic properties. For instance, when TAB60 was fractured along P3, their flexural strength and fracture toughness were as low as 56 ± 1.47 MPa and 1.13 ± 0.14 MPa m1/2. Corresponding values are about 1/3 for strength and 1/2 for fracture toughness of those fractured along P1 and P2 directions.

When TAB60 was fractured along P3 (Fig. 2d), larger cracks mainly propagated along basal planes of hBN, which were bonded by weak van der Waals forces of ~50 MPa. Conversely, both mechanical property values increased significantly when loading was applied in the other two directions due to the fact that larger energy was required to break in-plane strong covalent B–N bonds. It is worth mentioning that as-calculated critical crack sizes for TAB along different directions (143.1–207.5 μm) were much larger than the average grain size of hBN, TiB2 and AlN, possibly as a result of interconnected hBN grains, acting as a longer chain to initiate the fracture. On the plus side, the larger critical crack size (Table 1) indicates these samples are not sensitive to cracks either introduced into ceramics during processing or machining (with size normally below 100 μm). TAB60 has a smaller strength deviation (~1%–5% of strength value), compared with that of advanced ceramics (~10%–20%), also proving this point.

Figure 2 Fracture surfaces of sintered TAB27 and TAB60 along different loading directions. (a) P1 and (b) P3 directions for TAB27; (c) P1 and (d) P3 directions for TAB60. EDS mappings shown in (e) were collected from an enlarged area in (d).
Table 1 Summary on mechanical properties of sintered TAB27 and TAB60 along three loading directions
Electrical resistivities of both TAB27 and TAB60 parallel and perpendicular to the pressure direction increased linearly with increasing temperatures (Fig. 3). Electrical resistivity values of TAB60 were about an order of magnitude greater than those of TAB27 due to the higher intrinsic electrical resistivity of hBN (>1010 mΩ cm at room temperature). For TAB27, electrical resistivity values perpendicular to the pressure direction (4.28 × 10⁻²–1.82 × 10⁻¹ mΩ cm) were ~15% lower than those of the parallel direction (5.08 × 10⁻² –2.13 × 10⁻¹ mΩ cm) from room temperature to 1000°C (Fig. 3a), indicating that there was only small difference on temperature dependence of electrical resistivity along the two directions. On the contrary, TAB60 demonstrated typical electrical resistivity anisotropy. When temperature was elevated, the values perpendicular to the pressure direction were obviously lower than those of parallel, and their electrical resistivity gap became even larger. Electrical resistivity values perpendicular to the pressure direction (0.194–0.831 mΩ cm) were ~58.2% lower than those of the parallel direction (0.465–1.990 mΩ cm) from room temperature to 1000°C (Fig. 3b). Corresponding slopes of the electrical resistivity versus temperature relationship were 6.53 × 10⁻⁹ Ω m K−1 for perpendicular and 1.57 × 10⁻⁸ Ω m K−1 for parallel, respectively. Although hBN has an indirect bandgap of 3.9 eV, additional interlayer conduction bands in its band structure make the bandgap along different directions different. This point dominated anisotropic differences in the electrical transport performance of TAB60 [29,30].

Figure 3 Schematic diagram of electrical conductivities of samples (a1) parallel and (a2) perpendicular to the pressure direction. Electrical resistivities and electrical conductivities along different directions of (b) TAB27 and (c) TAB60 as a function of temperature.
Total thermal conductivity of conductive boride ceramics (λTotal) is equal to the sum of contributions from electrons (λe) and phonons (λph) (Equation (9)). From the Wiedemann–Franz law, λe could be calculated from the electrical conductivity. Thereafter, λph can be estimated by subtracting the electron contribution from its total thermal conductivity.
λTotal = λe + λph. (9)
Temperature dependences on thermal conductivities of TAB27 and TAB60, together with contributions from both electron (λe) and phonon (λph) are compared in Fig. 4. With the increase of temperature, slight divergence in the thermal conductivity values of TAB27 occurred between two directions, both fluctuated in a narrow range between 45.25–55.38 W m−1 K−1 (Fig. 4a, b). Regarding to TAB60, perpendicular to the pressure direction (Fig. 4c), the values only reached 26.6433.45 W m−1 K−1 within the measured temperature range. Whilst parallel to pressure direction (Fig. 4d), thermal conductivity values went as high as 60.72–78.09 W m−1 K−1 that were about 130% higher than those of the parallel direction. Moreover, λe to the total thermal conductivity was exceedingly weak. Since heat conduction was mainly transferred along hBN in-plane, heat flow was substantially easier along the hBN layers than across them [31,32]. Consequently, TAB60 with anisotropy would lead to more favorable heat transfer along the direction perpendicular to the pressure (Fig. 4d).

Figure 4 Thermal conductivities and contributions of electron and phonon to the total thermal conductivities of different samples along both directions as a function of temperature. (a) TAB27 and (c) TAB60 perpendicular to the pressure direction; (b) TAB27 and (d) TAB60 parallel to the pressure direction.
Besides, the layer model, i.e., parallel and series models, was adopted to estimate the actual thermal conductivity of hBN flakes in TAB60 at room temperature, which simply assumed thermal conductivities of TAB60 were proportional to the volume fraction (ϕ) of matrix (TAB27) and hBN flakes (Equation (10)). Then, actual components of hBN flakes (λpar and λper), parallel and perpendicular to the pressure direction, were calculated as 5.07 W m−1 K−1 (2–10 W m−1 K−1 reported) and 120.09 W m−1 K−1 (100–400 W m−1 K−1 reported), respectively [32,33].

Then, the effective medium theory (EMT) was used to further uncover the thermal conductivity anisotropy of TAB60, based on the modified analytic Equation (11) [34,35]:

where λ|| and λ⊥ represent thermal conductivities of TAB60 parallel and perpendicular to the pressure direction at room temperature, respectively. λmatrix is the thermal conductivity of the matrix, λhBN is the parallel component (120.09 W m−1 K−1) of hBN flakes. f is the volume fraction of hBN flakes and h is the thickness of hBN flakes (~100 nm). r is the thermal boundary resistance and θ is the angle between the matrix axis and local symmetric axis for hBN flakes.
Based on the fact that θ tended to be zero in TAB60, its r value was 1.17 × 10⁻⁷ m² K W−1. Then, the theoretical thermal conductivity of TAB60 and corresponding anisotropy index (AI, AI= λ||/λ⊥) as a function of angle (θ) could be calculated (Fig. 5). Considering that the slight anisotropy was caused by in-situ hBN flakes in the matrix (Fig. 4a, b), it may explain the reason why λ|| and λ⊥ were unequal at θ = 45°. In fact, TAB ceramics with targeted θ values could be obtained by cutting the samples along designed directions, and by this means, further designing and manipulating the mechanical and physical property anisotropy in conductive ceramics and composites could be realized.

Figure 5 Calculated theoretical thermal thermal conductivity of TAB60 and corresponding AI as a function of angle (θ).
Temperature dependences on thermal strains for TAB27 and TAB60 were plotted in Fig. 6, and averaged thermal expansion coefficients (CTEs) between 296 and 1273 K were calculated according to Equation (12), which was 7.56 × 10⁻⁶ K−1 for TAB27. Regarding to TAB60, a difference was noticed between the two directions with CTE values of 7.03 × 10⁻⁶ K−1 perpendicular to the pressure direction and 7.90 × 10⁻⁶ K−1 parallel to the pressure direction, respectively. These differences could be explained by the intrinsic thermal expansion anisotropy of hBN, which has a negative value of −2.40 × 10⁻⁶ K−1 along their basal plane and relatively large positive value of 36.40 × 10⁻⁶ K−1 across the hBN layers [23].


Figure 6 Thermal expansion curves for TAB27 and TAB60 along different directions as a function of temperature.
Then, thermal shock parameters for TAB could be calculated as listed in Table 2. On the whole, the thermal shock resistance was significantly improved with the incorporation of hBN flakes. As imagined, for TAB27 with isotropic properties, these thermal shock parameter values were similar to each other between the two directions with maximum differences less than ~15%. However, in TAB60, the thermal shock resistance exhibited obvious anisotropy. The thermal shock fracture factor (R) perpendicular to the pressure direction (92.1 K) was 91% higher than that of the parallel direction (48.2 K), but only a slight discrepancy occurred in the thermal shock resistance parameter (R′) as a result of anisotropic thermal conductivity values between the two directions. Derived from Equations (5) and (6), flexural strength (σf) played a greater impact on thermal shock damage factors (R′′′ and R′′′′). Thus, better R′′′ and R′′′′ were achieved parallel to the pressure direction. Apparently, thermal shock damage factors in TAB60 along loading directions are much higher than the others, indicating it has a higher ability to prevent material destruction especially under cyclic thermal shocks.
Table 2 Calculated thermal shock parameters of TAB27 and TAB60 perpendicular and parallel to the pressure direction
CONCLUSION
Starting from TiN-Al-B-hBN powder mixtures, conductive TiB2-AlN ceramics containing 27 and 60 vol% hBN were densified. Their texture characteristics, mechanical and thermo-physical properties were investigated. Additional hBN flakes were arranged perpendicular to the loading direction during sintering, so that the property anisotropy of hBN can be inherited into the final composites. It makes the flexural strength and fracture toughness of TAB60 perpendicular to the load direction significantly better than corresponding values parallel to the loading direction. The electrical and thermal conductivities parallel to the loading direction are 2.39 and 2.41 times of those perpendicular to the loading direction. As those physical properties changed, thermal shock parameters of TiB2-AlN-60 vol% hBN composites at different directions could be tailored as well. Through careful controlling of hBN arrangement angle in composites, effective regulation on mechanical and physical properties of targeted materials could be achieved.
References: Omitted
Declaration: This article is provided by CERADIR™ users or obtained from Internet, the content does not represent the position of CERADIR™. We are not responsible for the authenticity/accuracy of the article, especially the effects of the products concerned. This article is for study only, it does not constitute any investment or application advice. For reprinting, please contact the original author. If it involves the copyright and/or other issues, please contact us and we will deal with it asap! CERADIR™ has the interpretation of this declaration.